-
Notifications
You must be signed in to change notification settings - Fork 141
100_090_Legend
Previous Chapter Previous Page Next Page Next Chapter Table of content
- legend
- legendBlockSize
- legendBorders
- legendBordersColors
- legendBordersWidth
- legendFontColor
- legendFontFamily
- legendFontSize
- legendFontStyle
- legendColorIndicatorStrokeWidth
- showSingleLegend
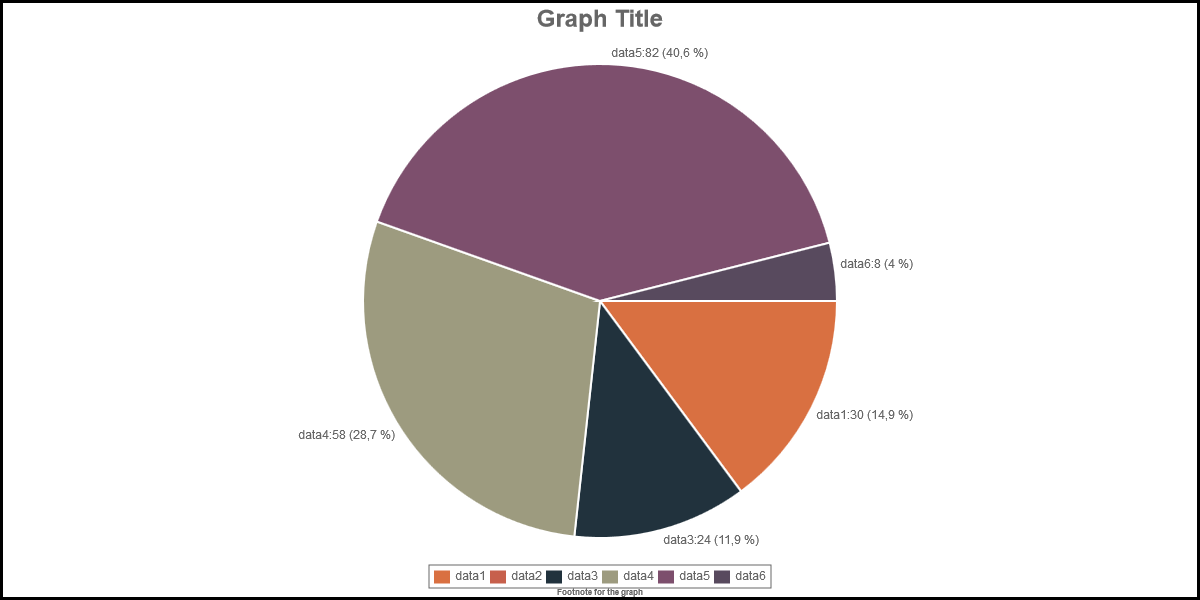
Description: At the bottom of the graph, it is possible to dispay a legend with a description of each color. Use option legend to draw the legend (legend : true) or to hide the legend (legend : false).
Graph Type : all
Values : true or false
Default Value : false
Sample : legend : true.
See also: inGraphDataDisplay
Description: the size of the blocks in the legend is defined with option legendBlockSize (in pixels). Remark : the height of the block is equal to the value of option legendFontSize.
Graph Type : all
Values : any positive value.
Default Value : 15
Sample : legendBlockSize : 20.
See also: legendFontSize
Description: If you want to surround the block with a border, set option legendBorders to true.
Graph Type : all
Values : true or false
Default Value : true
Sample : legendBorders : true
See also: legendBordersColors, legendBordersWidth
Description: set the color of the borders surrounding the block with option legendBordersColor
Graph Type : all
Values : any valid color
Default Value : "#666"
Sample :
See also: legendBorders, legendBordersWidth
Description: set the width of the borders surrounding the block with option legendBordersColor
Graph Type : all
Values : any positive integer
Default Value : 1
Sample : legendBorderWidth : 3
See also:legendBorders, legendBordersColor
Description: specify the color of the text in the legend
Graph Type : all
Values : any valid color
Default Value : "#666"
Sample : legendFontColor : “black”
See also: legend, legendFontSize, legendFontStyle, legendFontFamily
Description: specify the font of the text in the legend
Graph Type : all
Values : any valid font
Default Value : "'Arial'"
Sample :
See also: legend, legendFontSize, legendFontStyle, legendFontColor
Description: specify the size of the text in the legend
Graph Type : all
Values : any positive integer
Default Value : 12
Sample : legendFontSize : 10
See also: legend, legendFontStyle, legendFontFamily, legendFontColor
Description: specify the style of the text in the legend
Graph Type : all
Values : any valid font style
Default Value : “normal”
Sample : legendFontStyle : “italic”
See also: legend, legendFontSize, legendFontFamily, legendFontColor
Description: If you use the datasetFill:false option in line charts you may want to change the height of the legend color.
Graph Types: line
Values: integer (px)
Default value: datasetStrokeWidth
Sample: datasetStrokeWidth:10
See also: #68
Description: If there is only one value in the legend, the legend is not displayed (in most of the case, poeple knows the signification of the unique displayed element in the graph). You can force the display of the legend even when there is only one value with option showSingleLegend.
Graph Types: All
Values: true or false
Default value: false
Sample: showSingleValue : true
See also:
Previous Chapter Previous Page Next Page Next Chapter Top of Page
