-
Notifications
You must be signed in to change notification settings - Fork 141
070_015_Bubbles
Francois Vancoppenolle edited this page Feb 23, 2017
·
6 revisions
Previous Chapter Previous Page Next Page Next Chapter Table of content
var data = {
labels : ["January","February","March","April","May","June","July"],
datasets : [
    {
        fillColor : "rgba(220,220,220,0.5)",
        strokeColor : "rgba(220,220,220,1)",
        pointColor : "rgba(220,220,220,1)",
        pointStrokeColor : "#fff",
        data : [65,59,90,81,56,55,40],
        bubble_data : [],
        title : "Year 2014"
    },
    {
        fillColor : "rgba(151,187,205,0.5)",
        strokeColor : "rgba(151,187,205,1)",
        pointColor : "rgba(151,187,205,1)",
        pointStrokeColor : "#fff",
        data : [28,48,40,19,96,27,100],
        bubble_data : [],
        title : "Year 2013"
    }
]
}
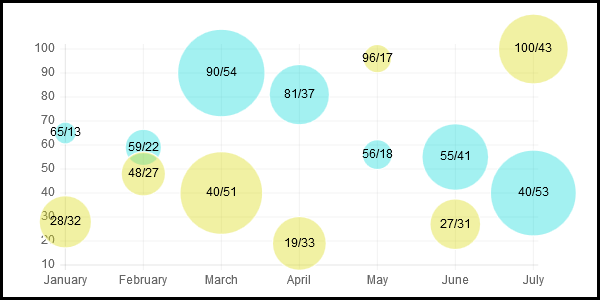
The data structure for the Bubble chart is very similar to the structure of the Line Chart. In fact, Bubble chart is just a variant of the Line Chart. For Bubble charts, you have to specify the ´bubble_data´ variable which characterise the radius of the bubble.
See Line structure for additional information.
Previous Chapter Previous Page Next Page Next Chapter Top of Page
