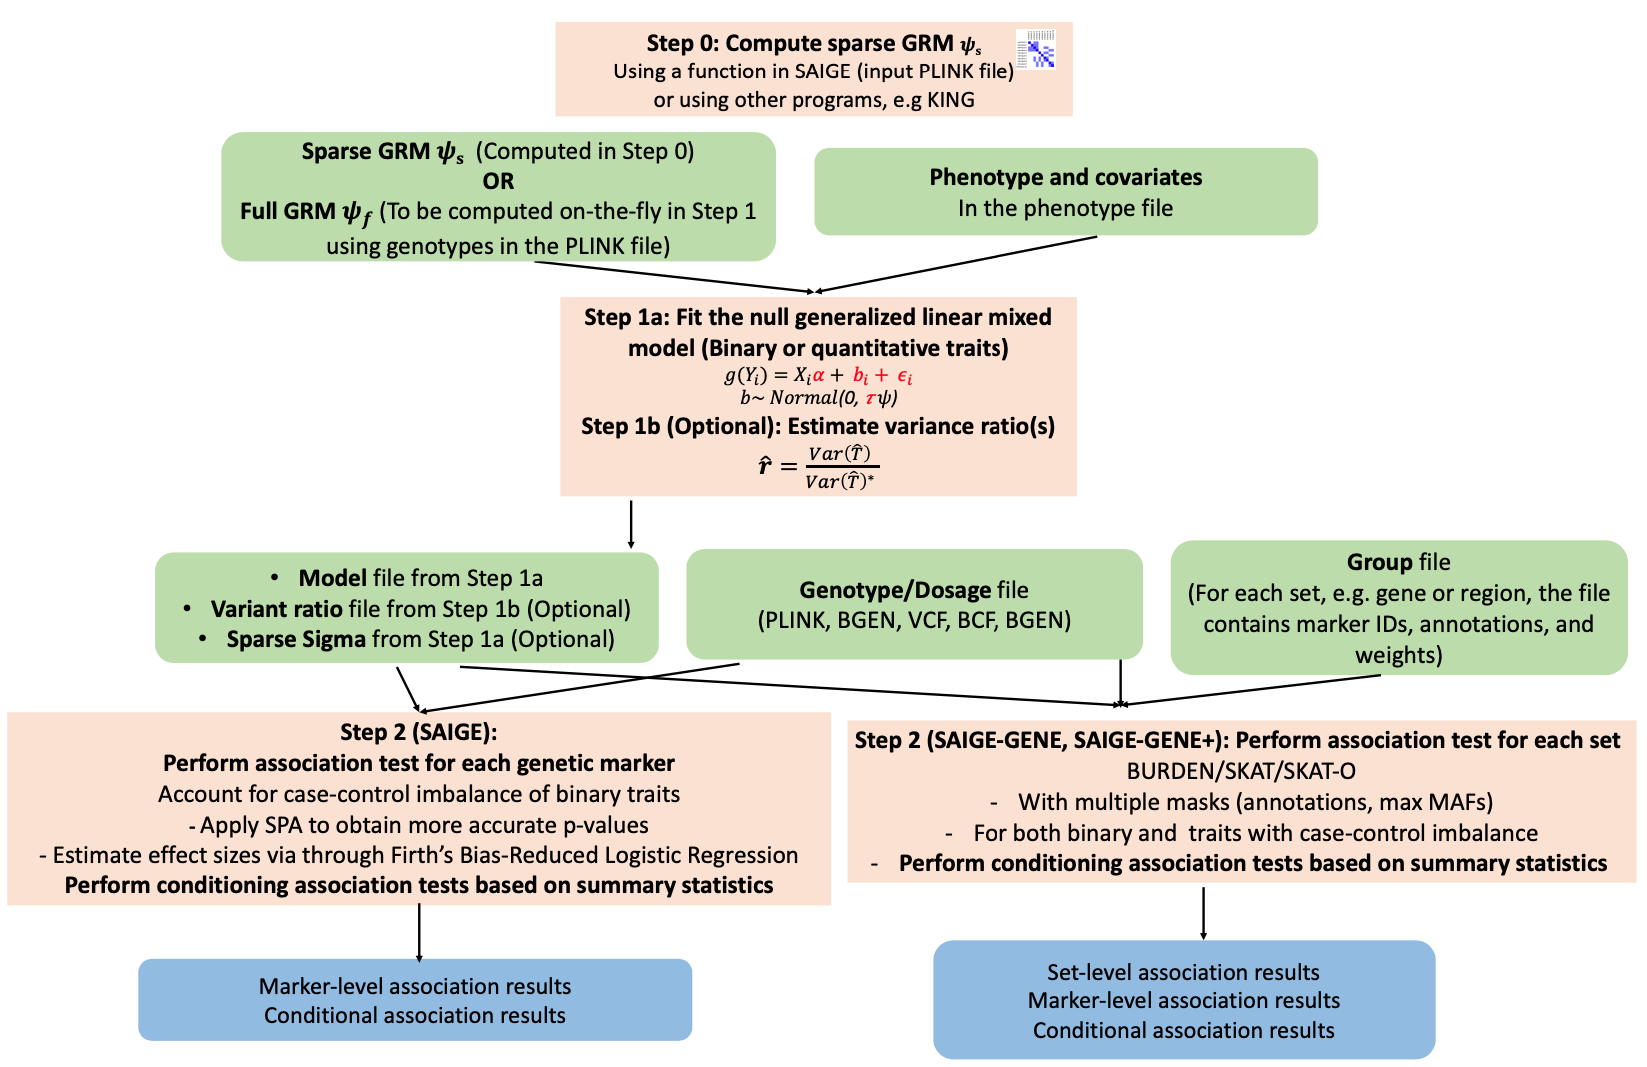
plink2 \
--bfile ~/sglee/SAIGE/input/nfam_100_nindep_0_step1_includeMoreRareVariants_poly \
--pca 10 \
--out ~/sglee/SAIGE/output/pca
plink2 \
--bfile ~/sglee/SAIGE/input/nfam_100_nindep_0_step1_includeMoreRareVariants_poly \
--make-king-table \
--out ~/sglee/SAIGE/output/GRM
- Documentation: https://saigegit.github.io//SAIGE-doc/
SAIGE is an R package for genome-wide association tests in large-scale biobanks.
docker run -v /BiO/kogo/home/edu01/sglee/SAIGE:/BiO/kogo/home/edu01/sglee/SAIGE wzhou88/saige:1.1.2 step1_fitNULLGLMM.R \
    --plinkFile=/BiO/kogo/home/edu01/sglee/SAIGE/input/nfam_100_nindep_0_step1_includeMoreRareVariants_poly \
    --phenoFile=/BiO/kogo/home/edu01/sglee/SAIGE/input/pheno_1000samples.txt_withdosages_withBothTraitTypes.txt \
    --phenoCol=y_binary \
    --covarColList=x1,x2 \
    --sampleIDColinphenoFile=IID \
    --traitType=binary \
    --outputPrefix=/BiO/kogo/home/edu01/sglee/SAIGE/output/example_binary \
    --nThreads=4 \
    --LOCO=FALSE \
    --IsOverwriteVarianceRatioFile=TRUE
docker run -v /BiO/kogo/home/edu01/sglee/SAIGE:/BiO/kogo/home/edu01/sglee/SAIGE wzhou88/saige:1.1.2 step1_fitNULLGLMM.R \
    --plinkFile=/BiO/kogo/home/edu01/sglee/SAIGE/input/nfam_100_nindep_0_step1_includeMoreRareVariants_poly \
    --phenoFile=/BiO/kogo/home/edu01/sglee/SAIGE/input/pheno_1000samples.txt_withdosages_withBothTraitTypes.txt \
    --phenoCol=y_quantitative \
    --covarColList=x1,x2 \
    --sampleIDColinphenoFile=IID \
    --traitType=quantitative \
    --invNormalize=TRUE \
    --outputPrefix=/BiO/kogo/home/edu01/sglee/SAIGE/output/example_quantitative \
    --nThreads=4 \
    --LOCO=FALSE \
    --IsOverwriteVarianceRatioFile=TRUE
docker run -v /BiO/kogo/home/edu01/sglee/SAIGE:/BiO/kogo/home/edu01/sglee/SAIGE wzhou88/saige:1.1.2 step2_SPAtests.R \
    --vcfFile=/BiO/kogo/home/edu01/sglee/SAIGE/input/saige_example.vcf.gz \
    --vcfFileIndex=/BiO/kogo/home/edu01/sglee/SAIGE/input/saige_example.vcf.gz.csi \
    --vcfField=GT \
    --SAIGEOutputFile=/BiO/kogo/home/edu01/sglee/SAIGE/output/step2_result.txt \
    --chrom=1 \
    --minMAF=0 \
    --minMAC=20 \
    --LOCO=FALSE \
    --GMMATmodelFile=/BiO/kogo/home/edu01/sglee/SAIGE/output/example_binary.rda \
    --varianceRatioFile=/BiO/kogo/home/edu01/sglee/SAIGE/output/example_binary.varianceRatio.txt \
    --is_output_moreDetails=TRUE
Using qqman package in R, we can draw plots.
library(qqman)

# Read GWAS summary statistics
gwas <- read.table('~/sglee/SAIGE/output/step2_result.txt', header=T)

# Draw Manhattan plot
png(file='~/sglee/SAIGE/output/manhattan_plot.png', width=1200, height=600)
manhattan(gwas, bp='POS', snp='MarkerID', p='p.value', main='Manhattan Plot')
dev.off()

# Draw Q-Q plot
png(file='~/sglee/SAIGE/output/qq_plot.png', width=1000, height=1000)
qq(gwas$p.value, main='Q-Q plot')
dev.off()
Using scp command, you can move PNG files to your local machine.
scp -rP 8517 '[email protected]:~/sglee/SAIGE/output/*.png' .
- UKB WES 200k PheWeb: https://ukb-200kexome.leelabsg.org/
- KoGES PheWeb: https://koges.leelabsg.org/
- FUMA (https://fuma.ctglab.nl/): platform that can be used to annotate, prioritize, visualize and interpret GWAS results.
Using SKAT package in R, we can conduct a gene-based association test.
library(SKAT)

File.Bed <- './Example1.bed'
File.Bim <- './Example1.bim'
File.Fam <- './Example1.fam'
File.SetID <- './Example1.SetID'

# Calling covariate file (Order of the sample ID must be same with the fam file)
# When there is no covariate file, use FAM<-Read_Plink_FAM(File.Fam, Is.binary = F)
# and object obj<-SKAT_Null_Model(y~X1+X2, out_type = 'C')
File.Cov <- './Example1.Cov'
FAM_Cov <- Read_Plink_FAM_Cov(File.Fam, File.Cov, Is.binary = F)

# Object file for Null model
obj <- SKAT_Null_Model(Phenotype~X1+X2, data=FAM_Cov, out_type = 'C')

# If the phenotype is binary one, out_type='D'
# When there is no covariate file, use FAM<-Read_Plink_FAM(File.Fam, Is.binary = F)
# and object obj <- SKAT_Null_Model(y~1, out_type = 'C')
# Please set file location and name for SSD file and SSD.info file
File.SSD<-'./Example1.SSD'
File.Info<-'./Example1.SSD.info'

# Generate and open SSD file for analysis
Generate_SSD_SetID(File.Bed, File.Bim, File.Fam, File.SetID, File.SSD, File.Info)
SSD.INFO <- Open_SSD(File.SSD, File.Info)
SSD.INFO$nSample
SSD.INFO$nSets

# Analysis
out <- SKAT.SSD.All(SSD.INFO, obj, method='SKATO')
out$results

# close SSD file
Close_SSD()
docker run -v /BiO/kogo/home/edu01/sglee/SAIGE-GENE:/BiO/kogo/home/edu01/sglee/SAIGE-GENE wzhou88/saige:1.1.2 createSparseGRM.R \
    --plinkFile=/BiO/kogo/home/edu01/sglee/SAIGE-GENE/input/saige_gene_example \
    --nThreads=4 \
    --outputPrefix=/BiO/kogo/home/edu01/sglee/SAIGE-GENE/output/sparseGRM \
    --numRandomMarkerforSparseKin=2000 \
    --relatednessCutoff=0.125
docker run -v /BiO/kogo/home/edu01/sglee/SAIGE-GENE:/BiO/kogo/home/edu01/sglee/SAIGE-GENE wzhou88/saige:1.1.2 step1_fitNULLGLMM.R \
    --sparseGRMFile=/BiO/kogo/home/edu01/sglee/SAIGE-GENE/output/sparseGRM_relatednessCutoff_0.125_2000_randomMarkersUsed.sparseGRM.mtx \
    --sparseGRMSampleIDFile=/BiO/kogo/home/edu01/sglee/SAIGE-GENE/output/sparseGRM_relatednessCutoff_0.125_2000_randomMarkersUsed.sparseGRM.mtx.sampleIDs.txt \
    --plinkFile=/BiO/kogo/home/edu01/sglee/SAIGE-GENE/input/saige_gene_example \
    --useSparseGRMtoFitNULL=TRUE \
    --phenoFile=/BiO/kogo/home/edu01/sglee/SAIGE-GENE/input/saige_gene_pheno.txt \
    --phenoCol=y_binary \
    --covarColList=x1,x2 \
    --qCovarColList=x2 \
    --sampleIDColinphenoFile=IID \
    --traitType=binary \
    --isCateVarianceRatio=TRUE \
    --outputPrefix=/BiO/kogo/home/edu01/sglee/SAIGE-GENE/output/step1_result \
    --IsOverwriteVarianceRatioFile=TRUE
docker run -v /BiO/kogo/home/edu01/sglee/SAIGE-GENE:/BiO/kogo/home/edu01/sglee/SAIGE-GENE wzhou88/saige:1.1.2 step2_SPAtests.R \
    --vcfFile=/BiO/kogo/home/edu01/sglee/SAIGE-GENE/input/genotype_100markers.vcf.gz \
    --vcfFileIndex=/BiO/kogo/home/edu01/sglee/SAIGE-GENE/input/genotype_100markers.vcf.gz.csi \
    --vcfField=GT \
    --SAIGEOutputFile=/BiO/kogo/home/edu01/sglee/SAIGE-GENE/output/step2_result.txt \
    --LOCO=FALSE \
    --chrom=1 \
    --minMAF=0 \
    --minMAC=0.5 \
    --sampleFile=/BiO/kogo/home/edu01/sglee/SAIGE-GENE/input/samplelist.txt \
    --GMMATmodelFile=/BiO/kogo/home/edu01/sglee/SAIGE-GENE/output/step1_result.rda \
    --varianceRatioFile=/BiO/kogo/home/edu01/sglee/SAIGE-GENE/output/step1_result.varianceRatio.txt \
    --sparseGRMFile=/BiO/kogo/home/edu01/sglee/SAIGE-GENE/output/sparseGRM_relatednessCutoff_0.125_2000_randomMarkersUsed.sparseGRM.mtx \
    --sparseGRMSampleIDFile=/BiO/kogo/home/edu01/sglee/SAIGE-GENE/output/sparseGRM_relatednessCutoff_0.125_2000_randomMarkersUsed.sparseGRM.mtx.sampleIDs.txt \
    --groupFile=/BiO/kogo/home/edu01/sglee/SAIGE-GENE/input/groupfile.txt \
    --annotation_in_groupTest=lof,missense:lof,missense:lof:synonymous \
    --maxMAF_in_groupTest=0.0001,0.001,0.01
DNAnexus provides a cloud-based data analysis and management platform for DNA sequence data. (https://www.dnanexus.com/)
You can also run SAIGE/SAIGE-GENE+ on DNAnexus.
More details can be found at: https://saigegit.github.io//SAIGE-doc/docs/UK_Biobank_WES_analysis.html
ANNOVAR (ANNOtate VARiation) is a bioinformatics software tool for the interpretation and prioritization of single nucleotide variants (SNVs), insertions, deletions, and copy number variants (CNVs) of a given genome. It has the ability to annotate human genomes hg18, hg19, and hg38.
-
Download ANNOVAR, perl and annotation database
- ANNOVAR: http://annovar.openbioinformatics.org/en/latest/user-guide/download/
- Perl: https://www.perl.org/get.html
- Download annotation database:
./annotate_variation.pl -buildver hg38 -downdb -webfrom annovar refGene humandb/
-
Make a table with annotation using the VCF file
./table_annovar.pl [VCF_FILENAME.vcf] humandb/ --outfile [FILENAME] --buildver hg38 --protocol refGene --operation g –vcfinput
If the process above is successfully performed, a file named [FILENAME].hg38_multianno.txt will be created.
You can download pre-prepared group files by chromosome here.
You can manually generate a group file for SAIGE-GENE or SetID file for SKAT using groupfile.R.
Usage: Rscript groupfile.R [method] [annotation_file] [mode] [gene_function_list] [exonic_function_list]
If you only type method and annovar output filename, the default mode selects only nonsynonymous SNV and loss of function (frameshift deletion, frameshift insertion, startloss, stopgain, stoploss) variant from each gene.
The mode All selects every variant in the gene
If you set the mode as manual, you must type specific gene function and exonic function of the markers. You type gene functions with ',' and do not put space between them.
Then, put space and do the same with exonic functions.
You can select among the lists below.
mode = {, All, manual}
gene_function_list = {downstream, exonic, exonic;splicing, intergenic, intronic, ncRNA_exonic, ncRNA_exonic;splicing, ncRNA_intronic, ncRNA_splicing, ncRNA_UTR5, splicing, upstream, upstream;downstream, UTR3, UTR5, UTR5;UTR3}
exonic_function_list = {frameshift_deletion, frameshift_insertion, nonframeshift_deletion, nonframeshift_insertion, nonsynonymous_SNV, startloss, stopgain, stoploss, synonymous_SNV}
Rscript groupfile.R SAIGE-GENE Annovar_output.csv manual exonic,intronic synonymous_SNV
Rscript groupfile.R SKAT Annovar_output.csv manual exonic,intronic,splicing frameshift_deletion,nonsynonymous_SNV

