This is a repository of code used to power the notebooks and interactive examples for https://em.geosci.xyz and https://gpg.geosci.xyz.
The examples are based on code available in SimPEG.
Interactive visualizations are a powerful way to interrogate mathematical equations. The goal of this repository is to be the home for code that can be plugged into jupyter notebooks so that we can play with the governing equations of geophysical electromagnetics.
The repository contains the python code to run the ipython-widget style apps in http://github.com/geoscixyz/geosci-labs. These are mainly plotting code and some simple analytics. More complex numerical simulations depend on SimPEG
The notebooks can be run online through Binder, or downloaded and run locally.
-
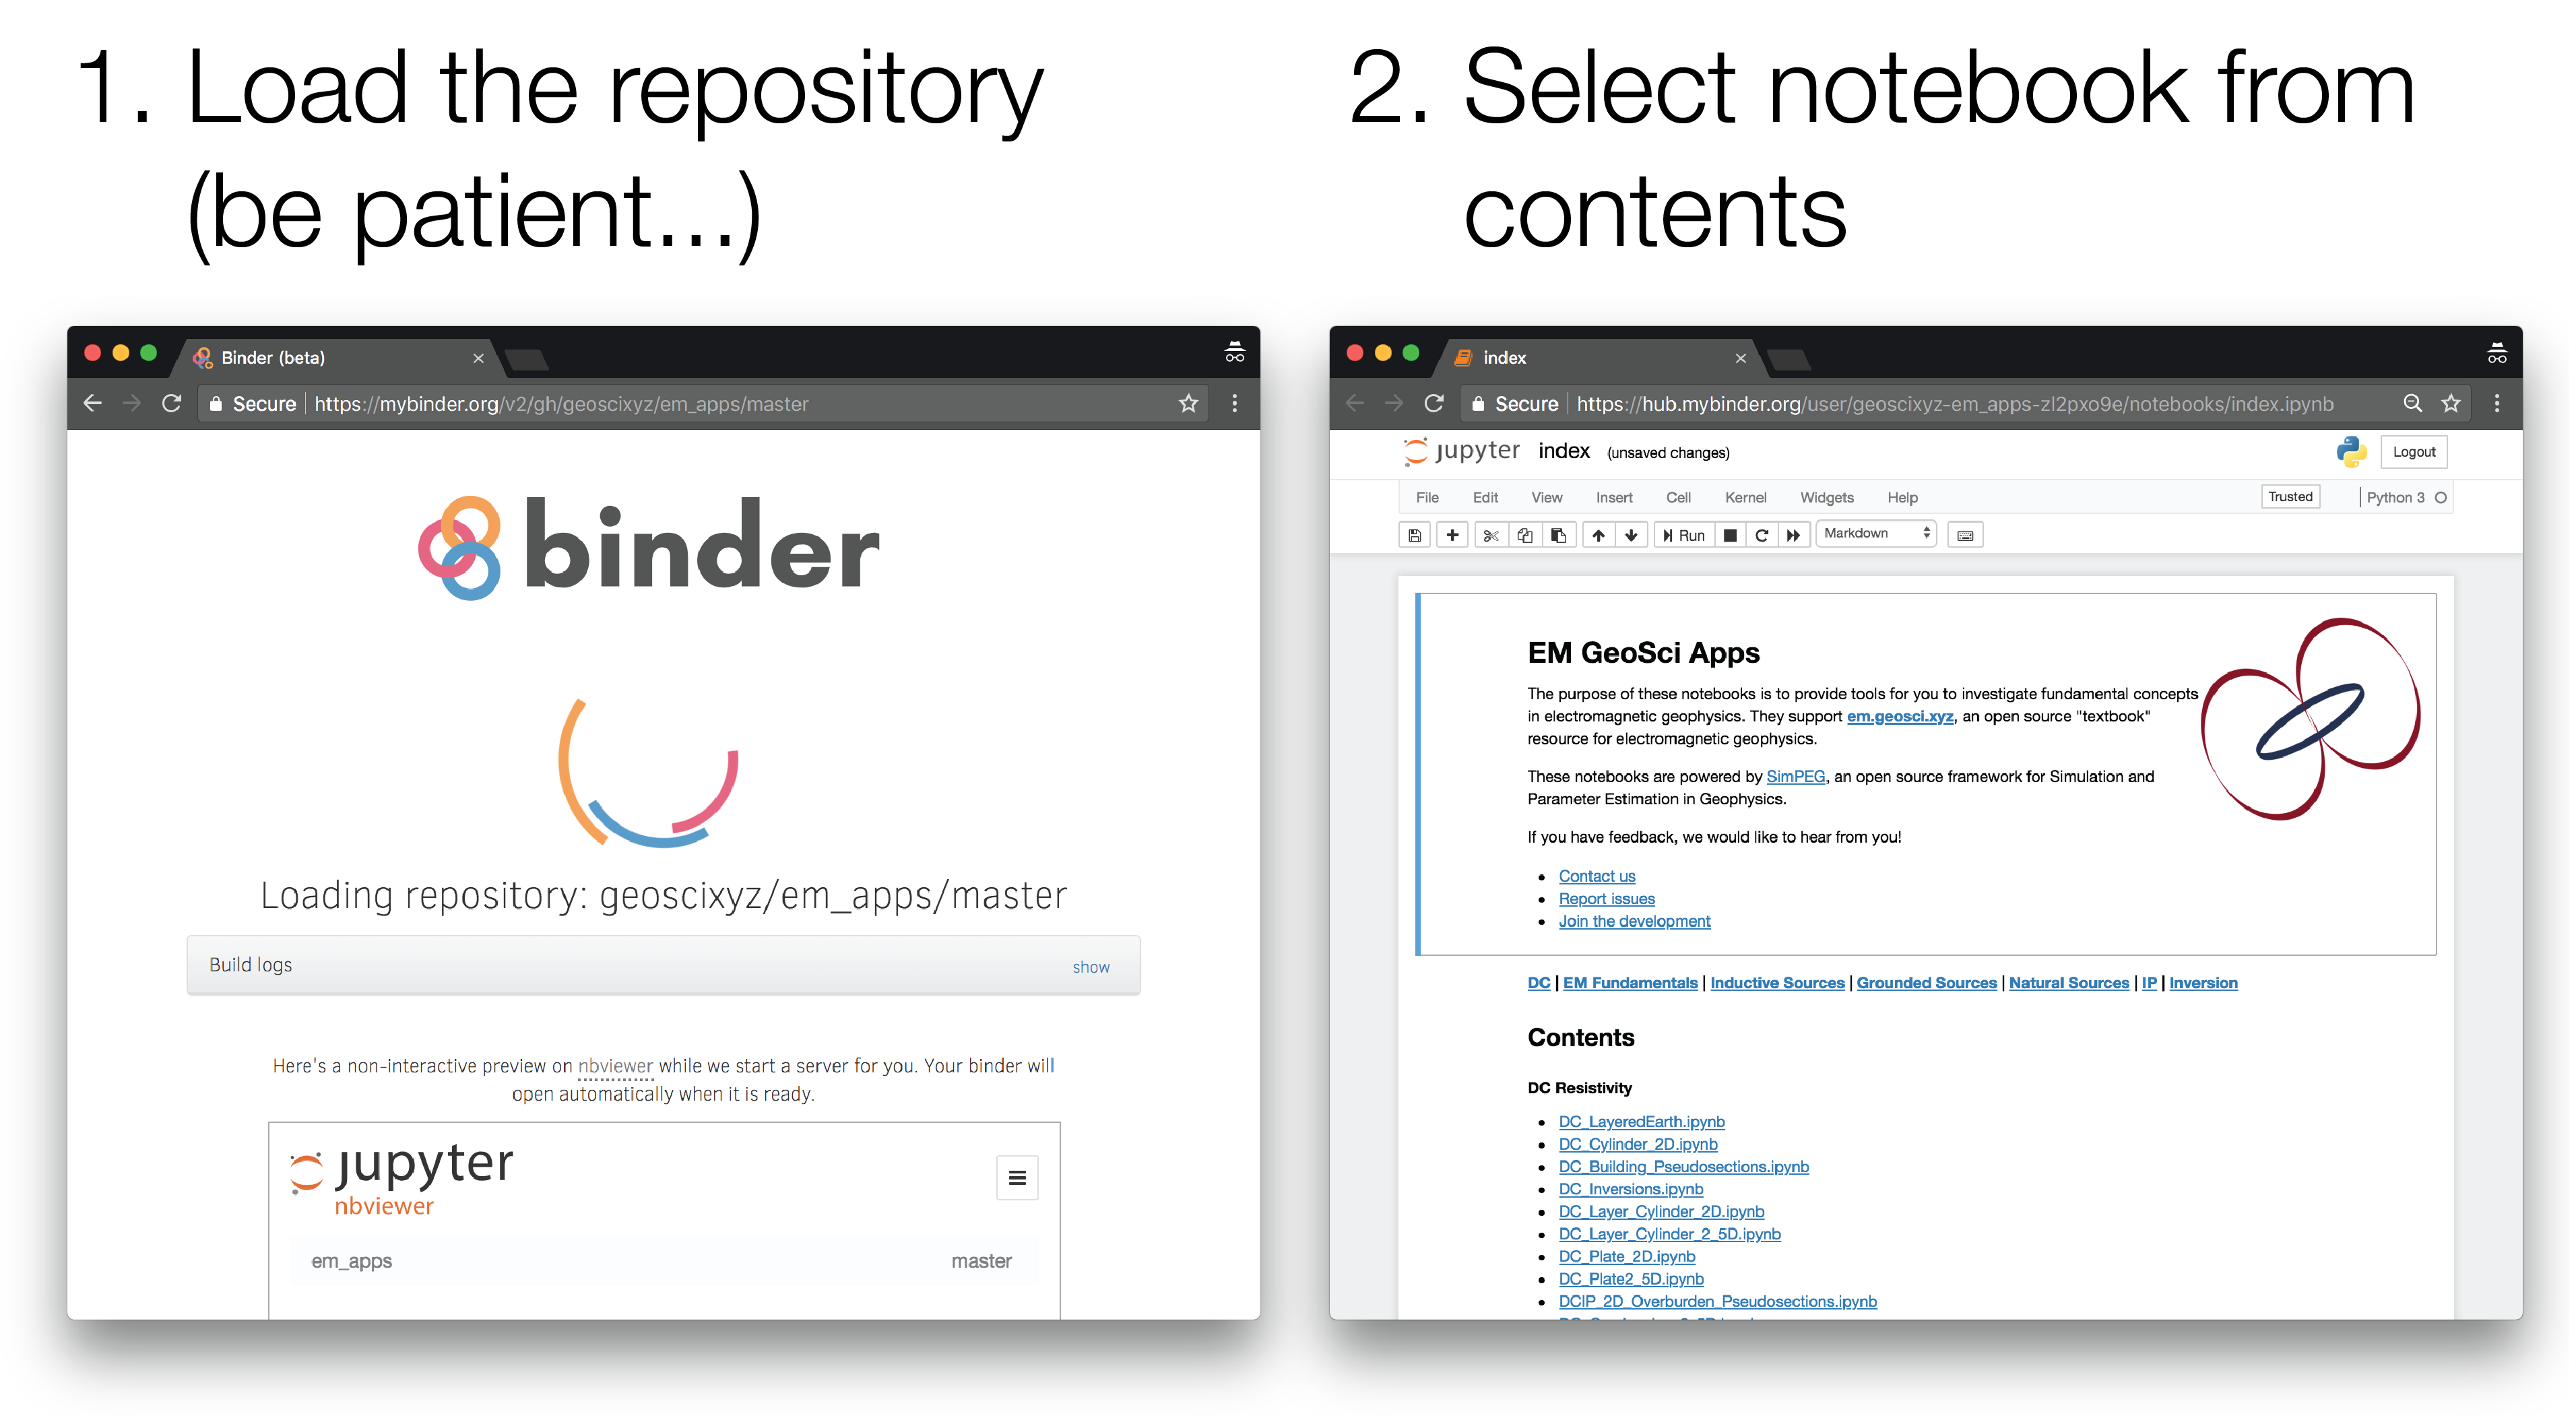
Launch the binder by clicking on the badge above or going to: https://mybinder.org/v2/gh/geoscixyz/geosci-labs/main?filepath=notebooks%2Findex.ipynb. This can sometimes take a couple minutes, so be patient...
-
Select the notebook of interest from the contents
To run them locally, you will need to have python installed, preferably through anaconda.
You can then clone this reposiroty. From a command line, run
git clone https://github.com/geoscixyz/geosci-labs.git
Then cd into geosci-labs
cd geosci-labs
To setup your software environment, we recommend you use the provided conda environment
conda env create -f environment.yml
conda activate geosci-labs
alternatively, you can install dependencies through pypi
pip install -r requirements.txt
You can then launch Jupyter
jupyter notebook
Jupyter will then launch in your web-browser.
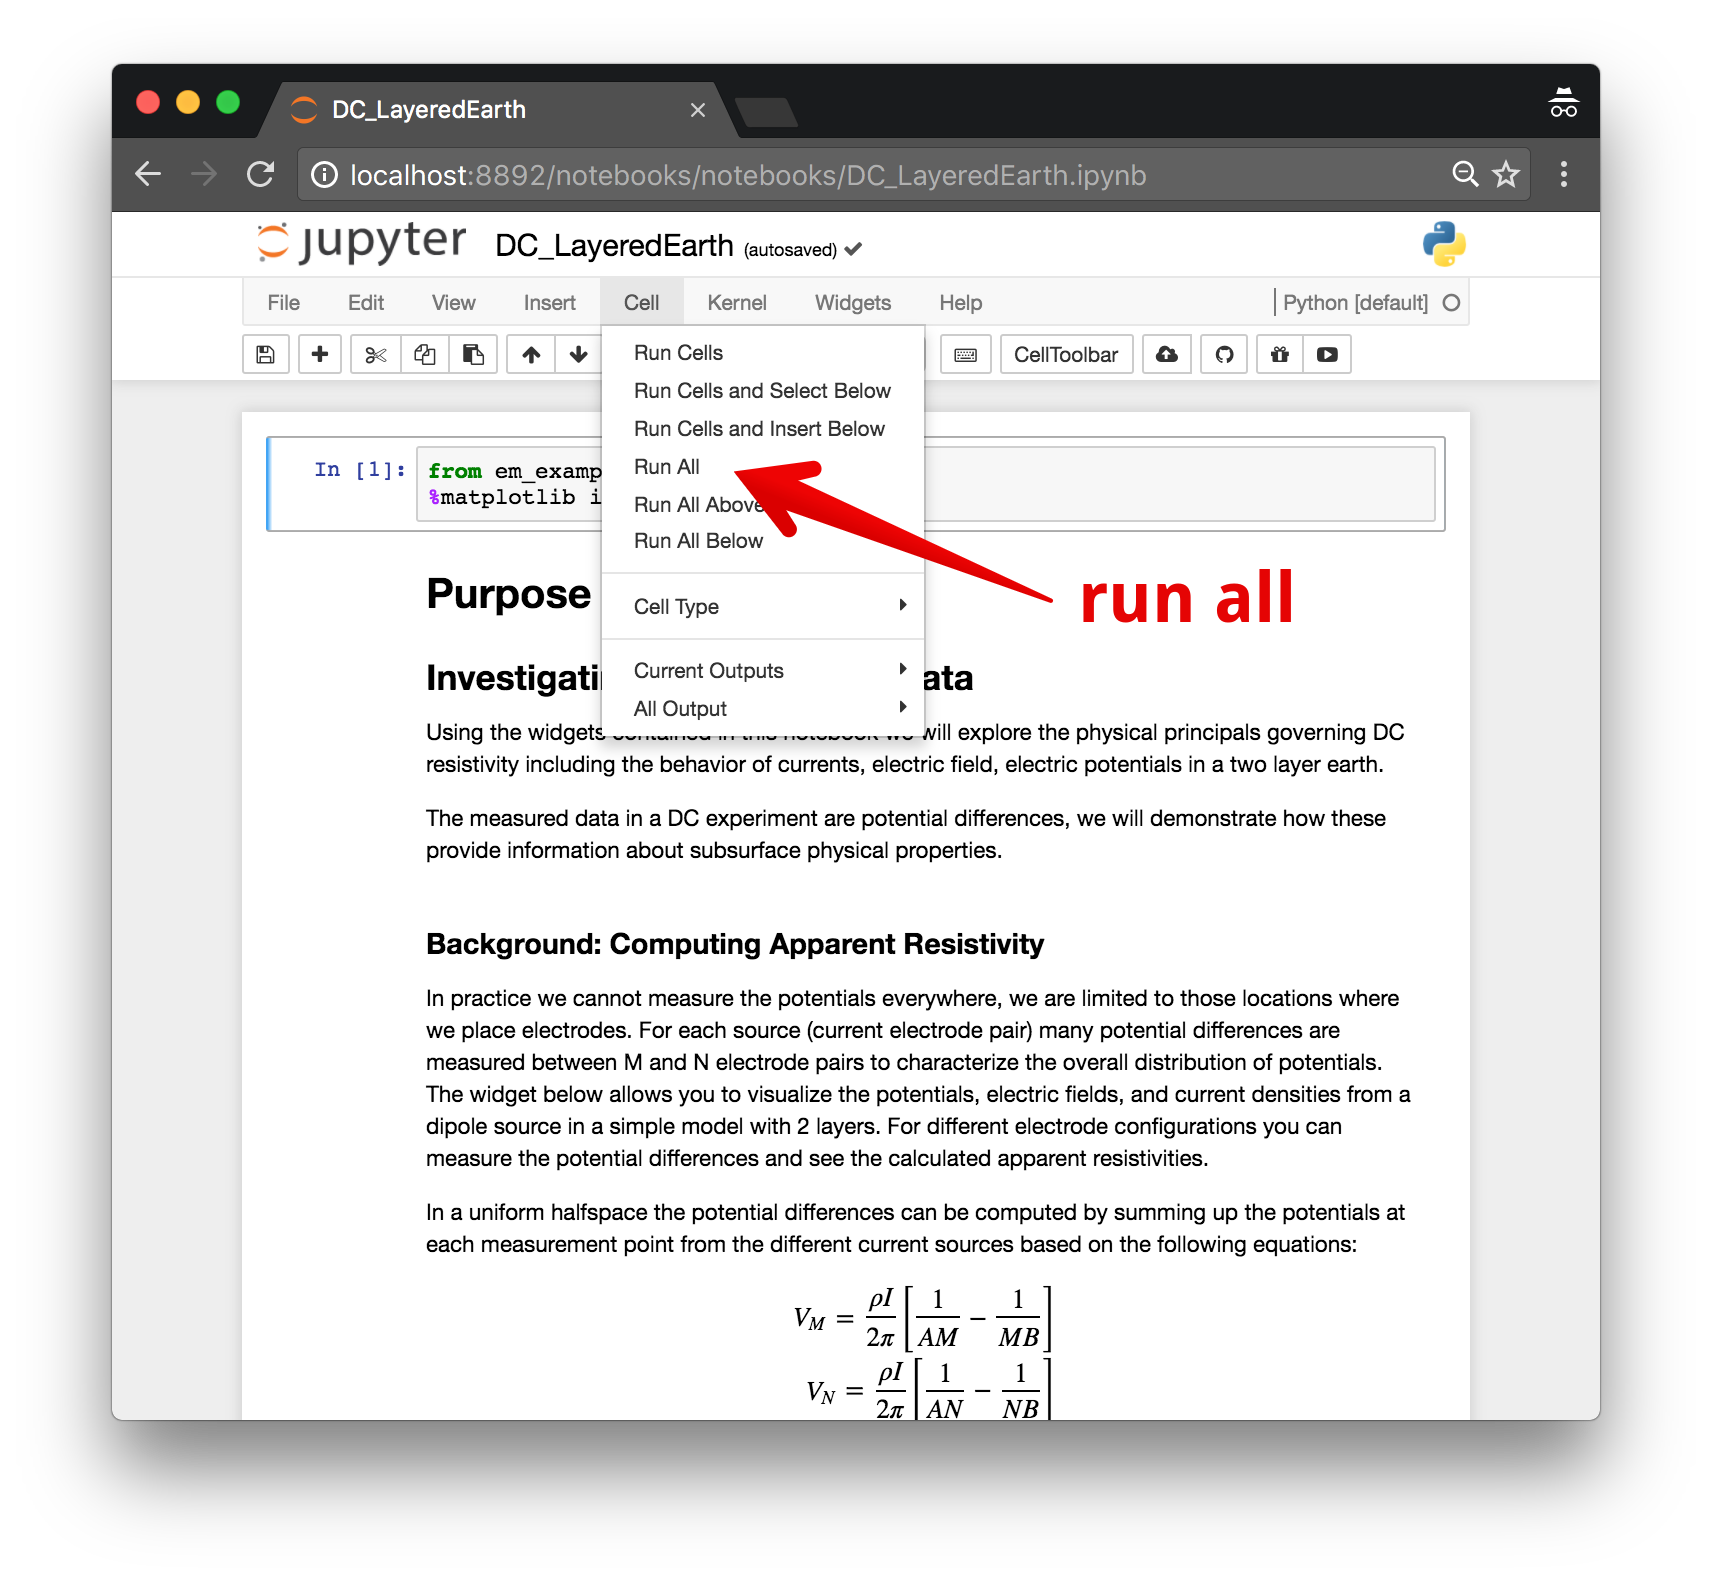
Each cell of code can be run with shift + enter or you can run the entire notebook by selecting cell, Run All in the toolbar.
For more information on running Jupyter notebooks, see the Jupyter Documentation
If you run into problems or bugs, please let us know by creating an issue in this repository.
We are glad you are interested in contributing! Please check out the contributing guide for ideas of how to get involved.


