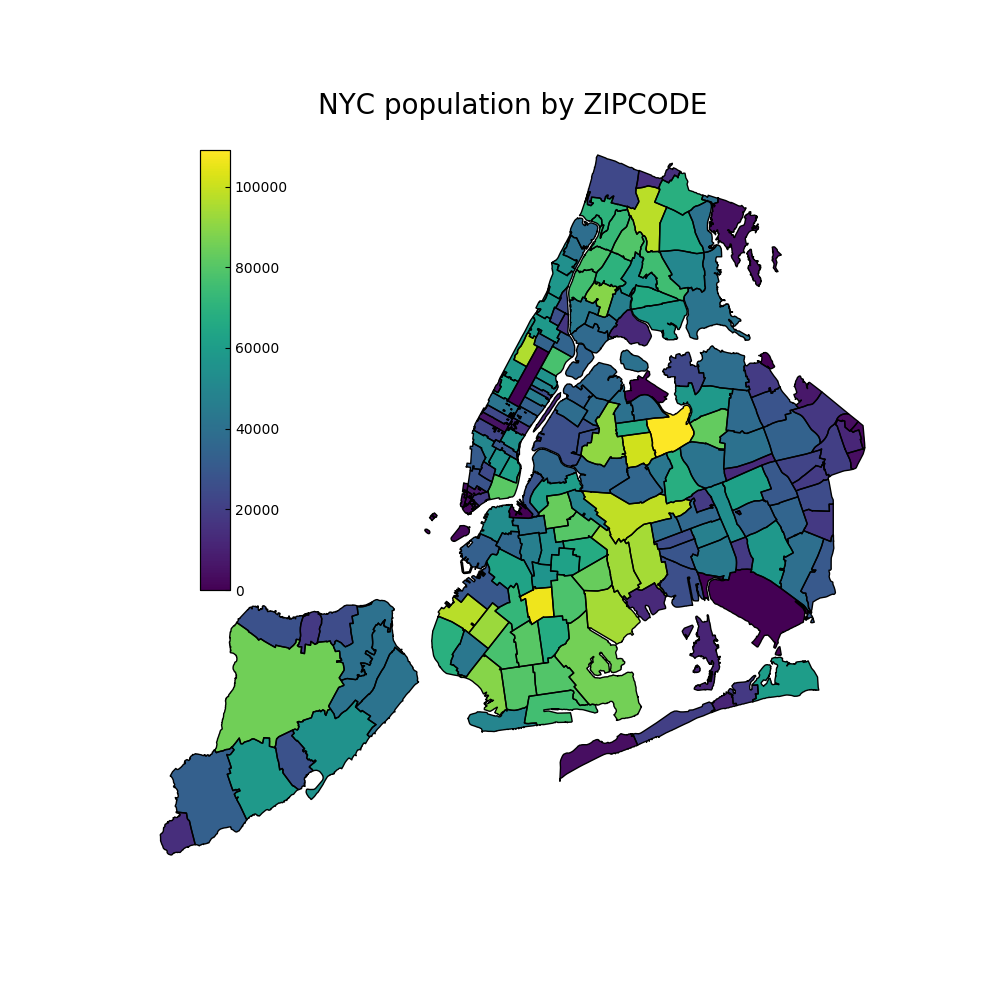
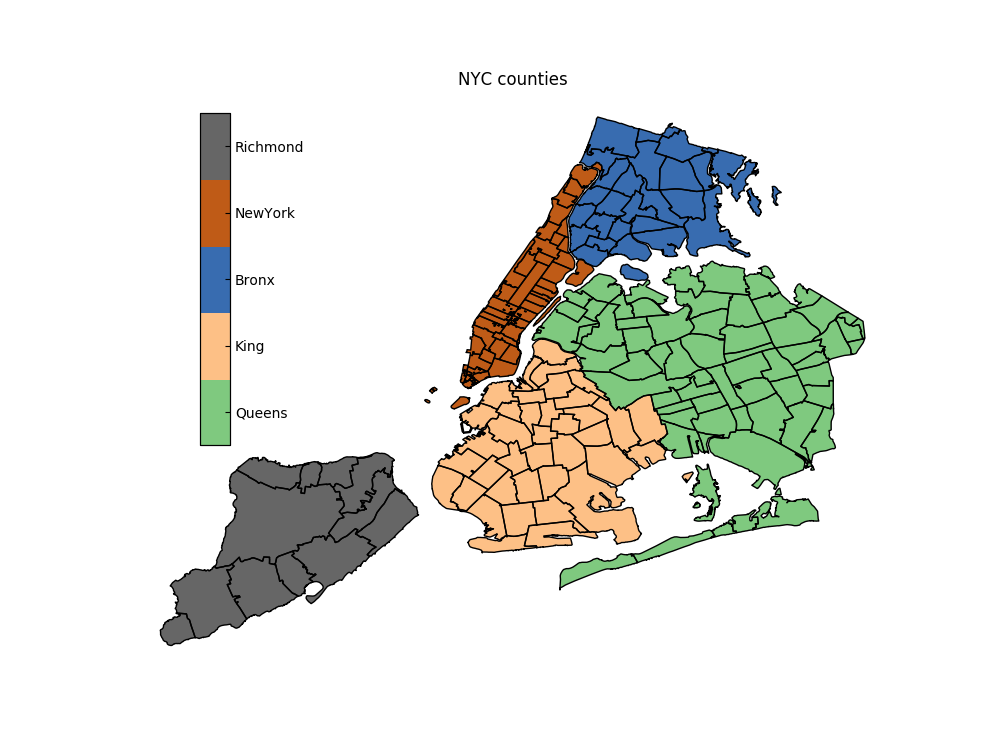
A function to make a choroplath of NYC from a shapefile data. The colorbar location is tuned to the shape of NYC (although it can be modified) and enabled both continuous and discrete color bars.
pip install git+https://github.com/fedhere/choroplethNYC.gitYou can call the function as :
f, ax, cb = cp.choroplethNYC(gdf, "column_name", kind='continuous', cmap="viridis")
with gdf a geopandas GeoDataFrame, with a valid geometry column, and with column_name a valid column name within the geo data frame (numerical or that can be converted to numerical).
You can call it from the command line (with limited costumization options) as
python choropleth.py file_path column_name
with optional arguments that include the colormap, whether the color bar should be continuous or in disctere steps, a figure title, a file output.
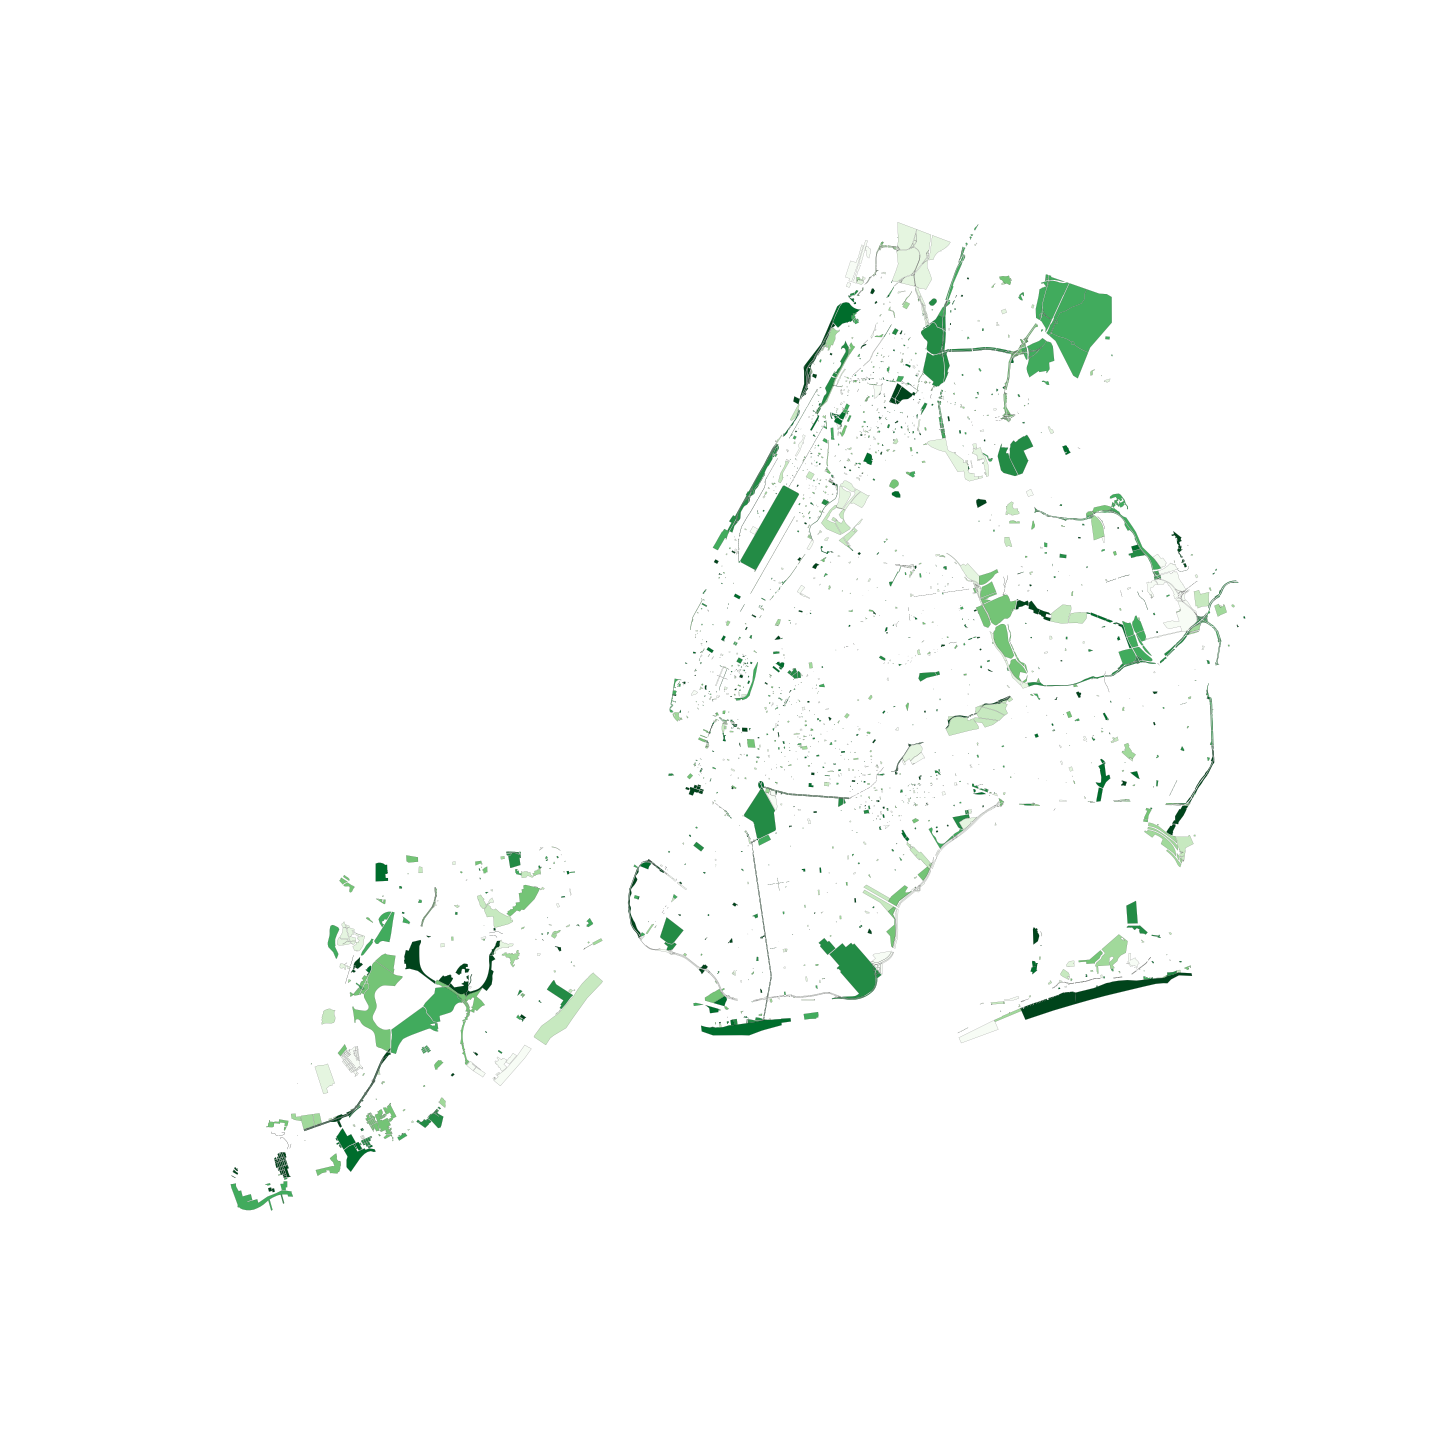
and finally without the color bar, since here the colors do not actually mean anything: NYC park properties


