Tracyprofiler #778
Tracyprofiler #778
Conversation
This made it impossible to enable
Flags that pertain to a specific library should be in CMakeLists.txt paired with it's `add_subdirectory` line. This keeps everything that is related near each other.
|
I just commited an update to tracy v0.7. This adds sampling profiling support on windows (I think it requires running both the profiler and the game as admin though), you can get a precompiled client exe in its release page https://github.com/wolfpld/tracy/releases/tag/v0.7 (The .7z file). This is what it looks like, for example in a slight spike in SSM which clearly shows most time is spent creating the texture and decoding the image using stb: To enable the sampled data view in the profiler you have to hit this ghost button Here's another spike in SSM to showcase something else tracy does: I'm not sure how much we would use it but it also has this really nice disassembly view with sampling percentages: This video showcases some of the stuff in v0.7, mostly the sampling profiling and disassembly view: https://www.youtube.com/watch?v=_hU7vw00MZ4 |


|
to those who dont want to read so much (lmao) heres how to do the profiling: (assuming you have the game compiled and running under 64bit)
|
2b272fa
to
5714418
Compare
Update tracy to 0.7.6
|
@poco0317 what do you think about merging this? |
|
i am only opposed because it introduces a whole lot of code that will almost never run |
|
For regular builds without
They're exactly the same. And you can see in Tracy.hpp that all the preoprocessor defines are defined to nothing without TRACY_ENABLE: https://github.com/etternagame/etterna/blob/tracyprofiler/extern/tracy/Tracy.hpp#L7-L96 for example #define ZoneScopedUnless your concern is about the maintainability/readability and not runtime code size/overhead. Tracy is a lot of code to add to extern, and between the three commits that added integration (ade070d , 589e6a0 and 85f631b ) there's about ~600 lines of our code touched (Although I think the majority of them are just adding indentation to move code into a block) |

|
i know they are the same, the problem is the added code which does not run, the readability |
Tracy is an intrusive Open Source frame profiler licensed under the 3-clause BSD license.
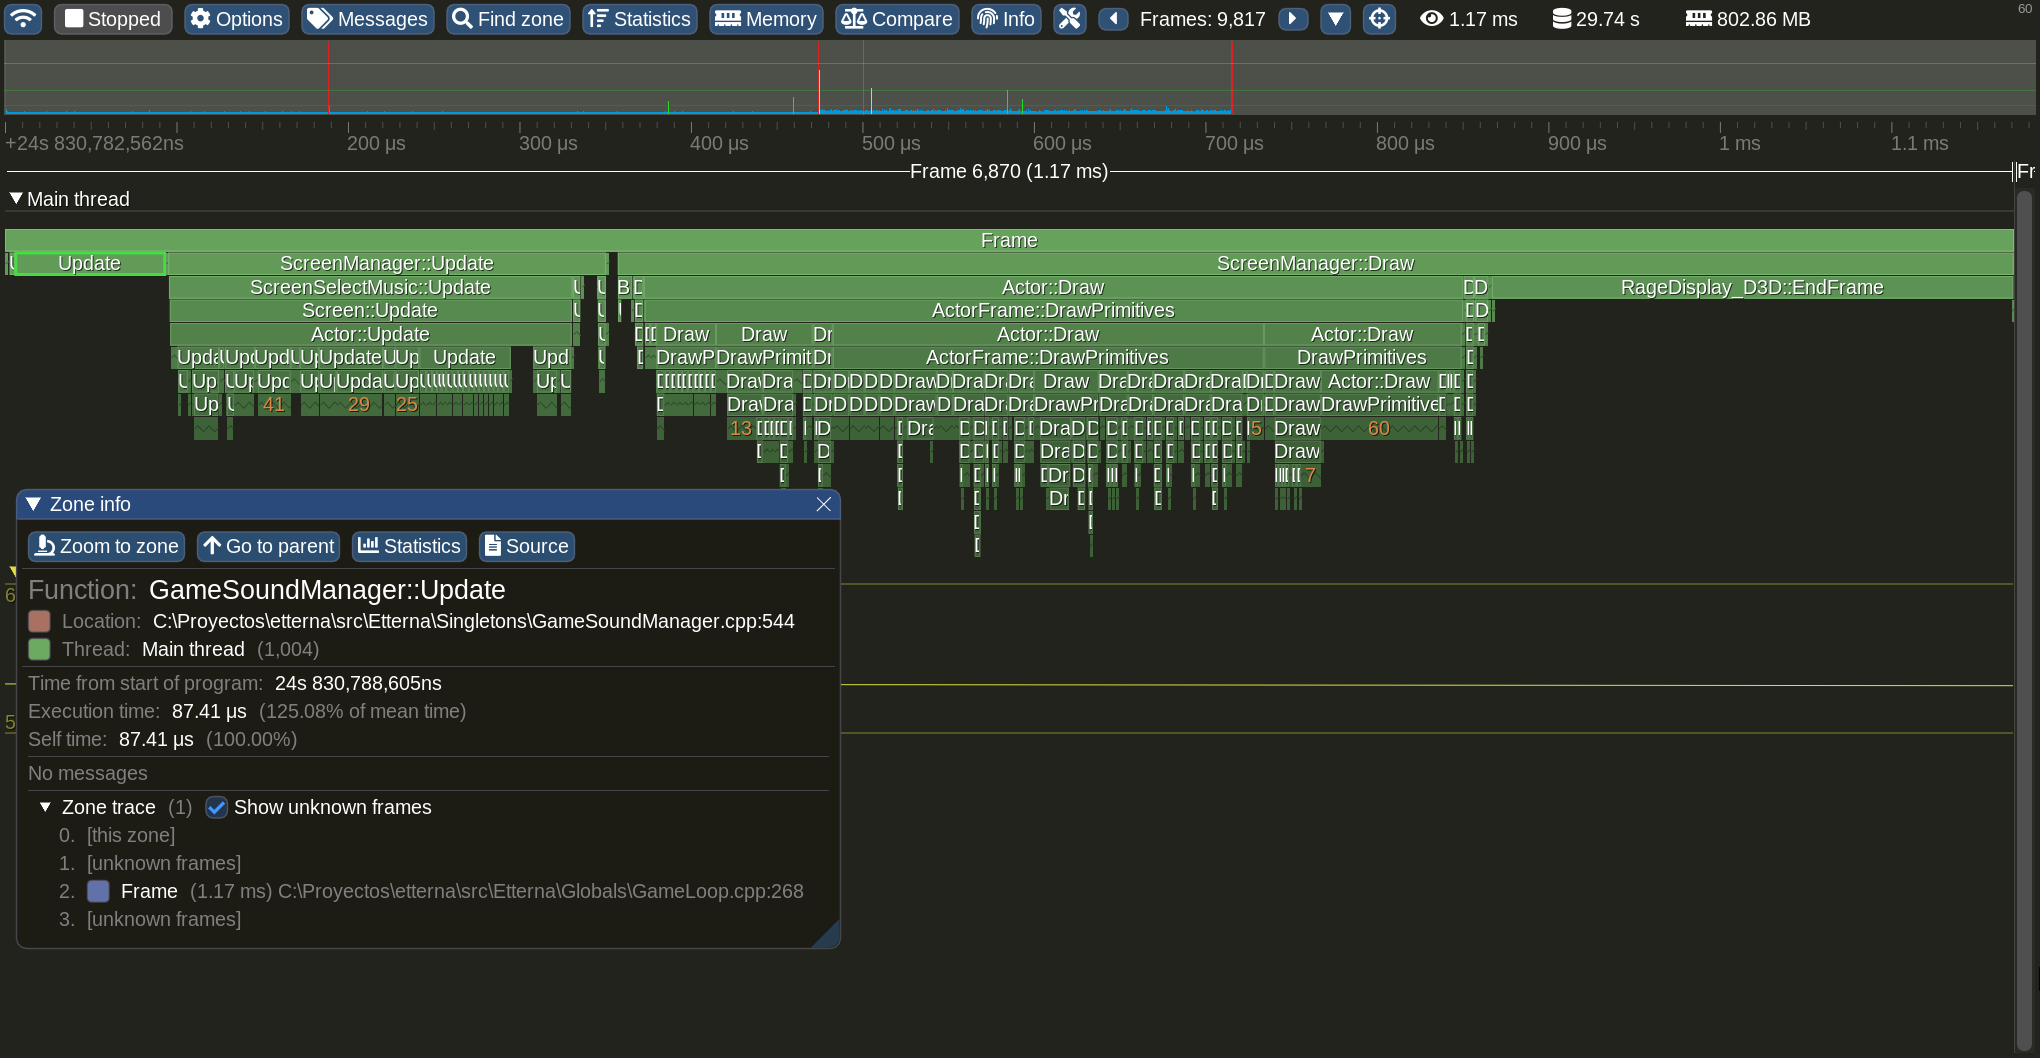
Tracy collects timings of scopes that one explicitly marks in code, usually using macros for convenience that give it information like line numbers, files, function name, etc. It tracks timings within each frame, and has a graph view of frame times which easily lets one find spikes

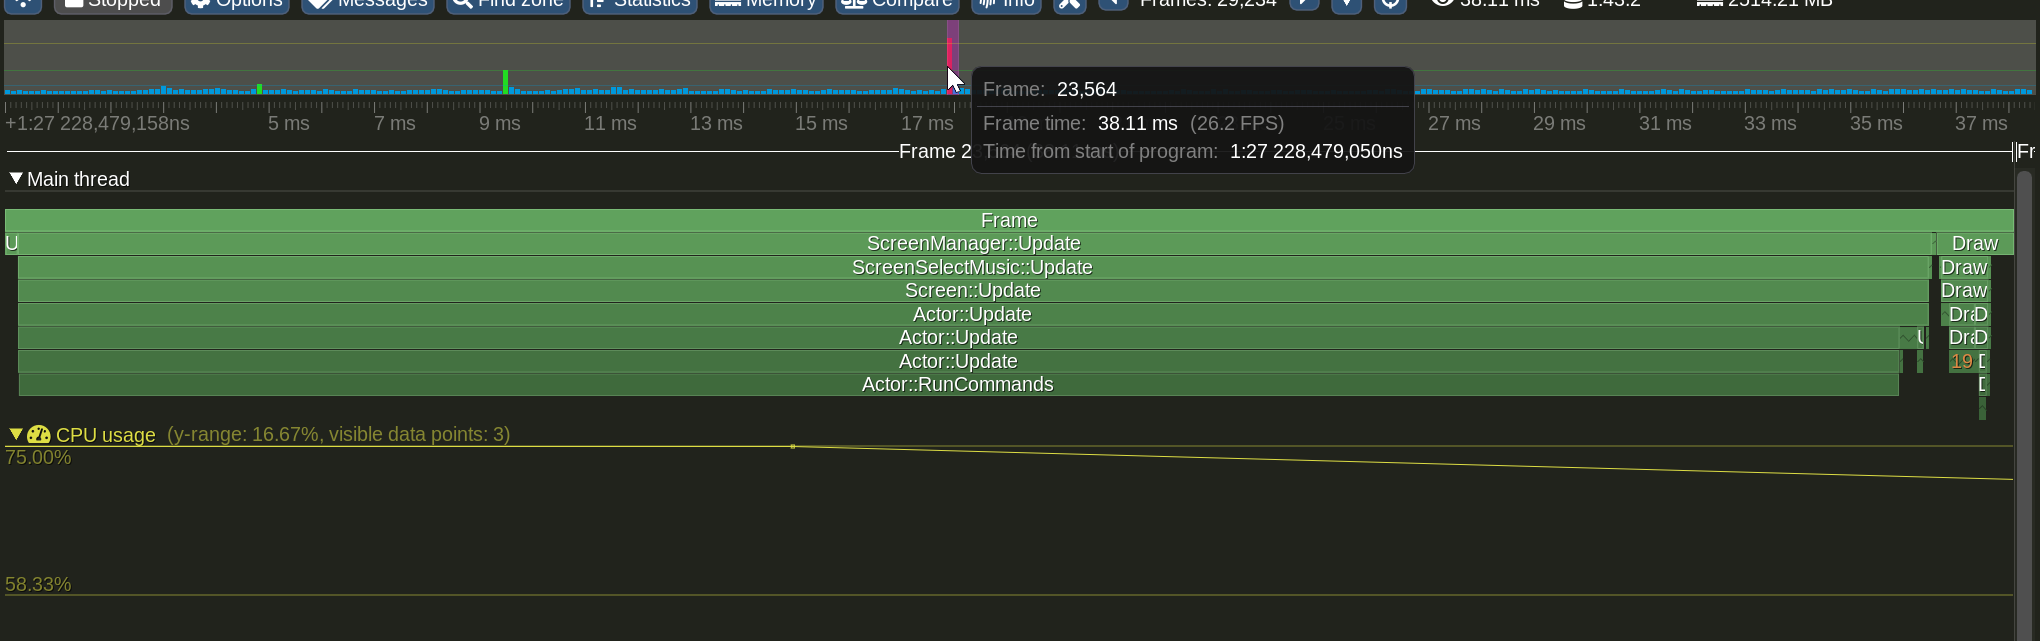
And then look at a flamegraph-like graph of specifically that frame
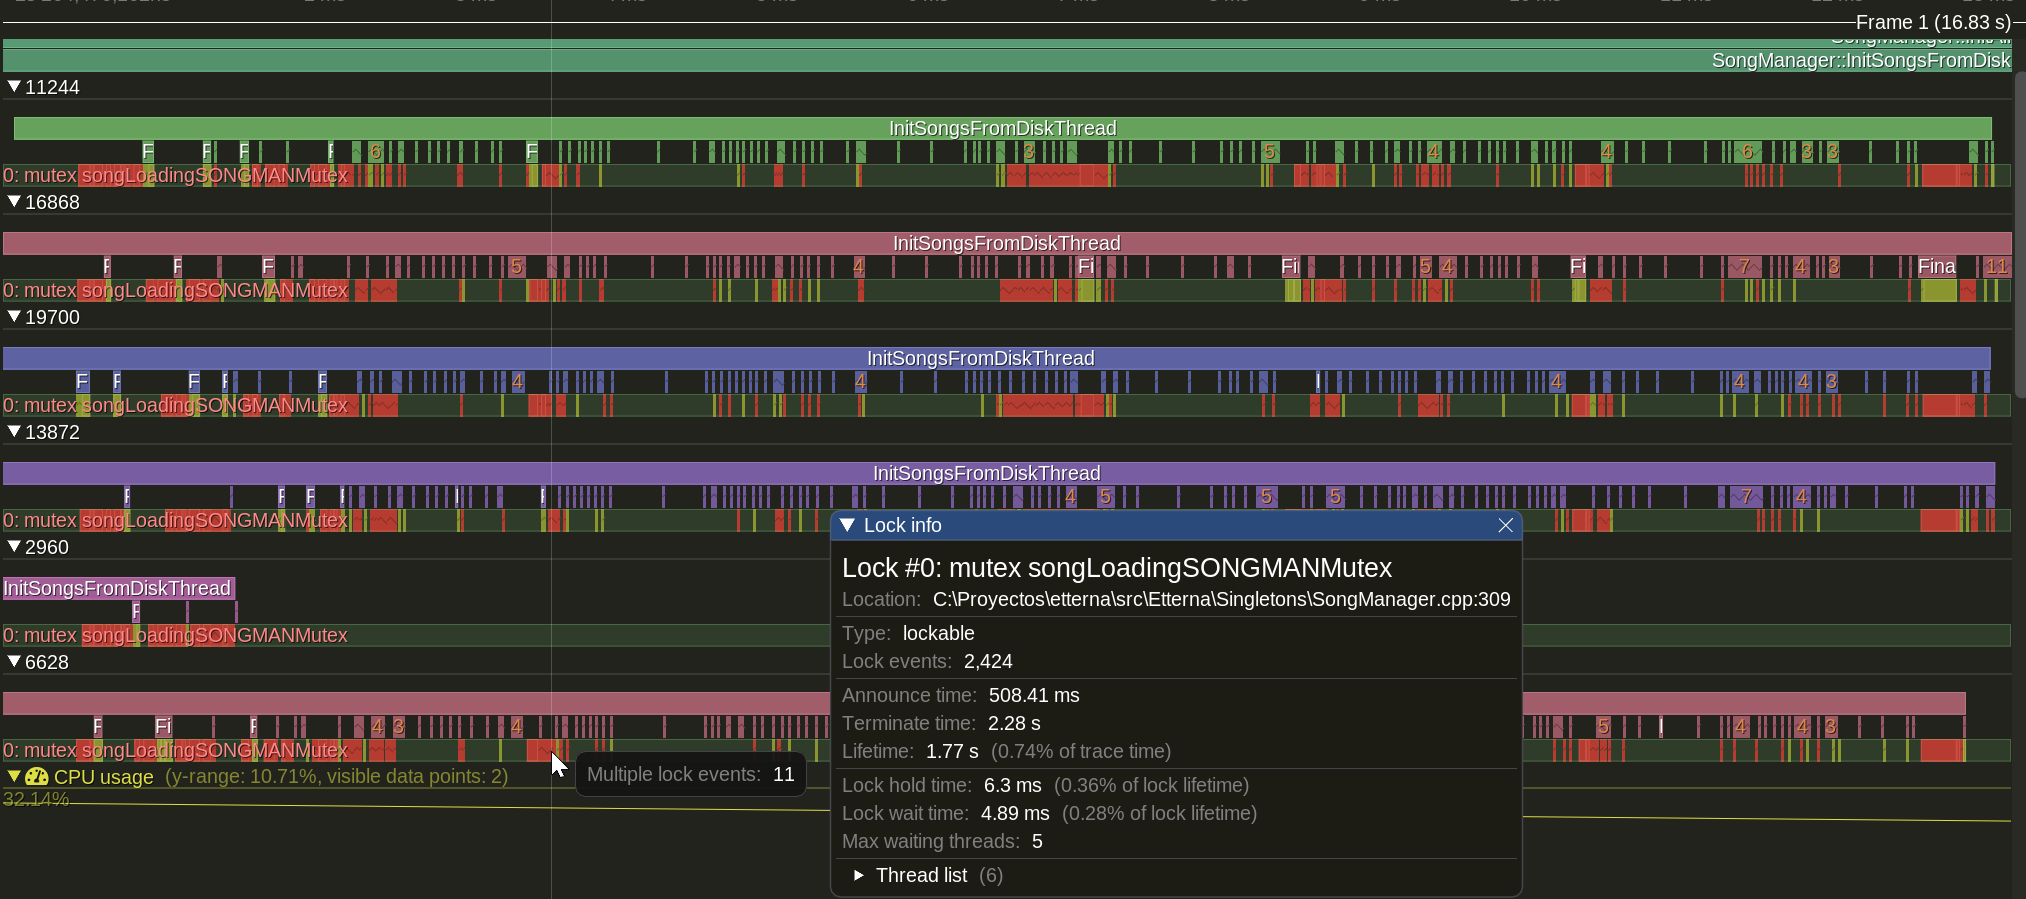
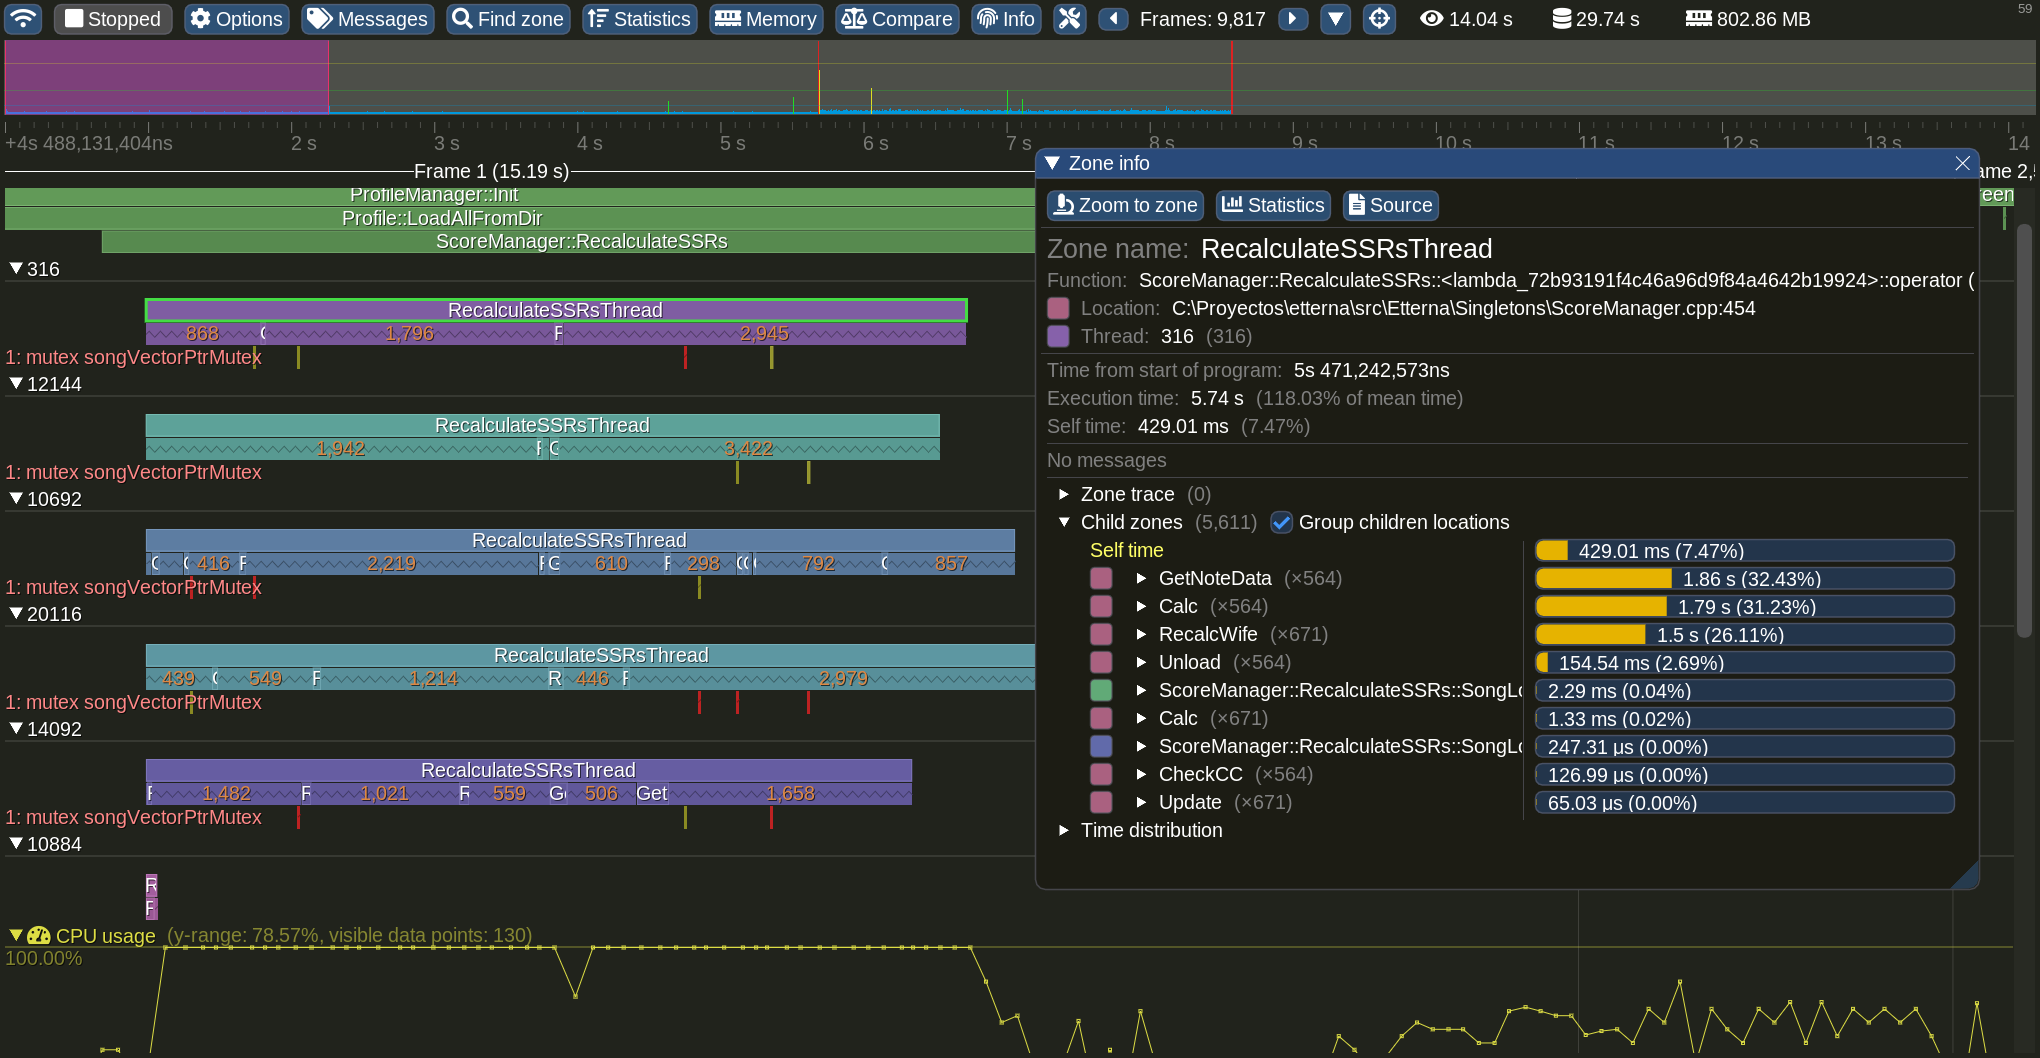
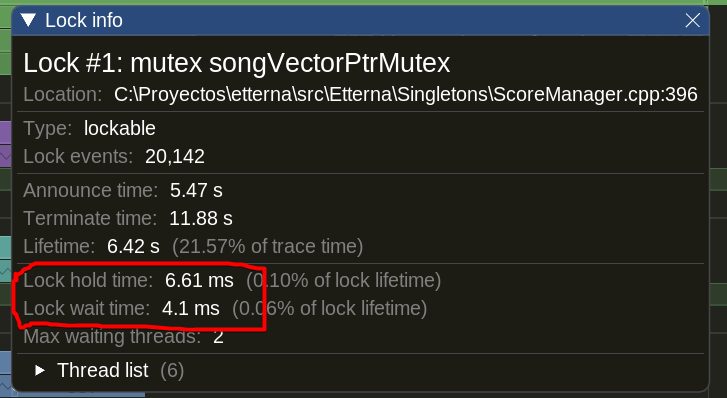
It supports multithreading, and if one annotates mutexes/locks, it can also track every time a mutex was locked, and the total time spent waiting for a mutex
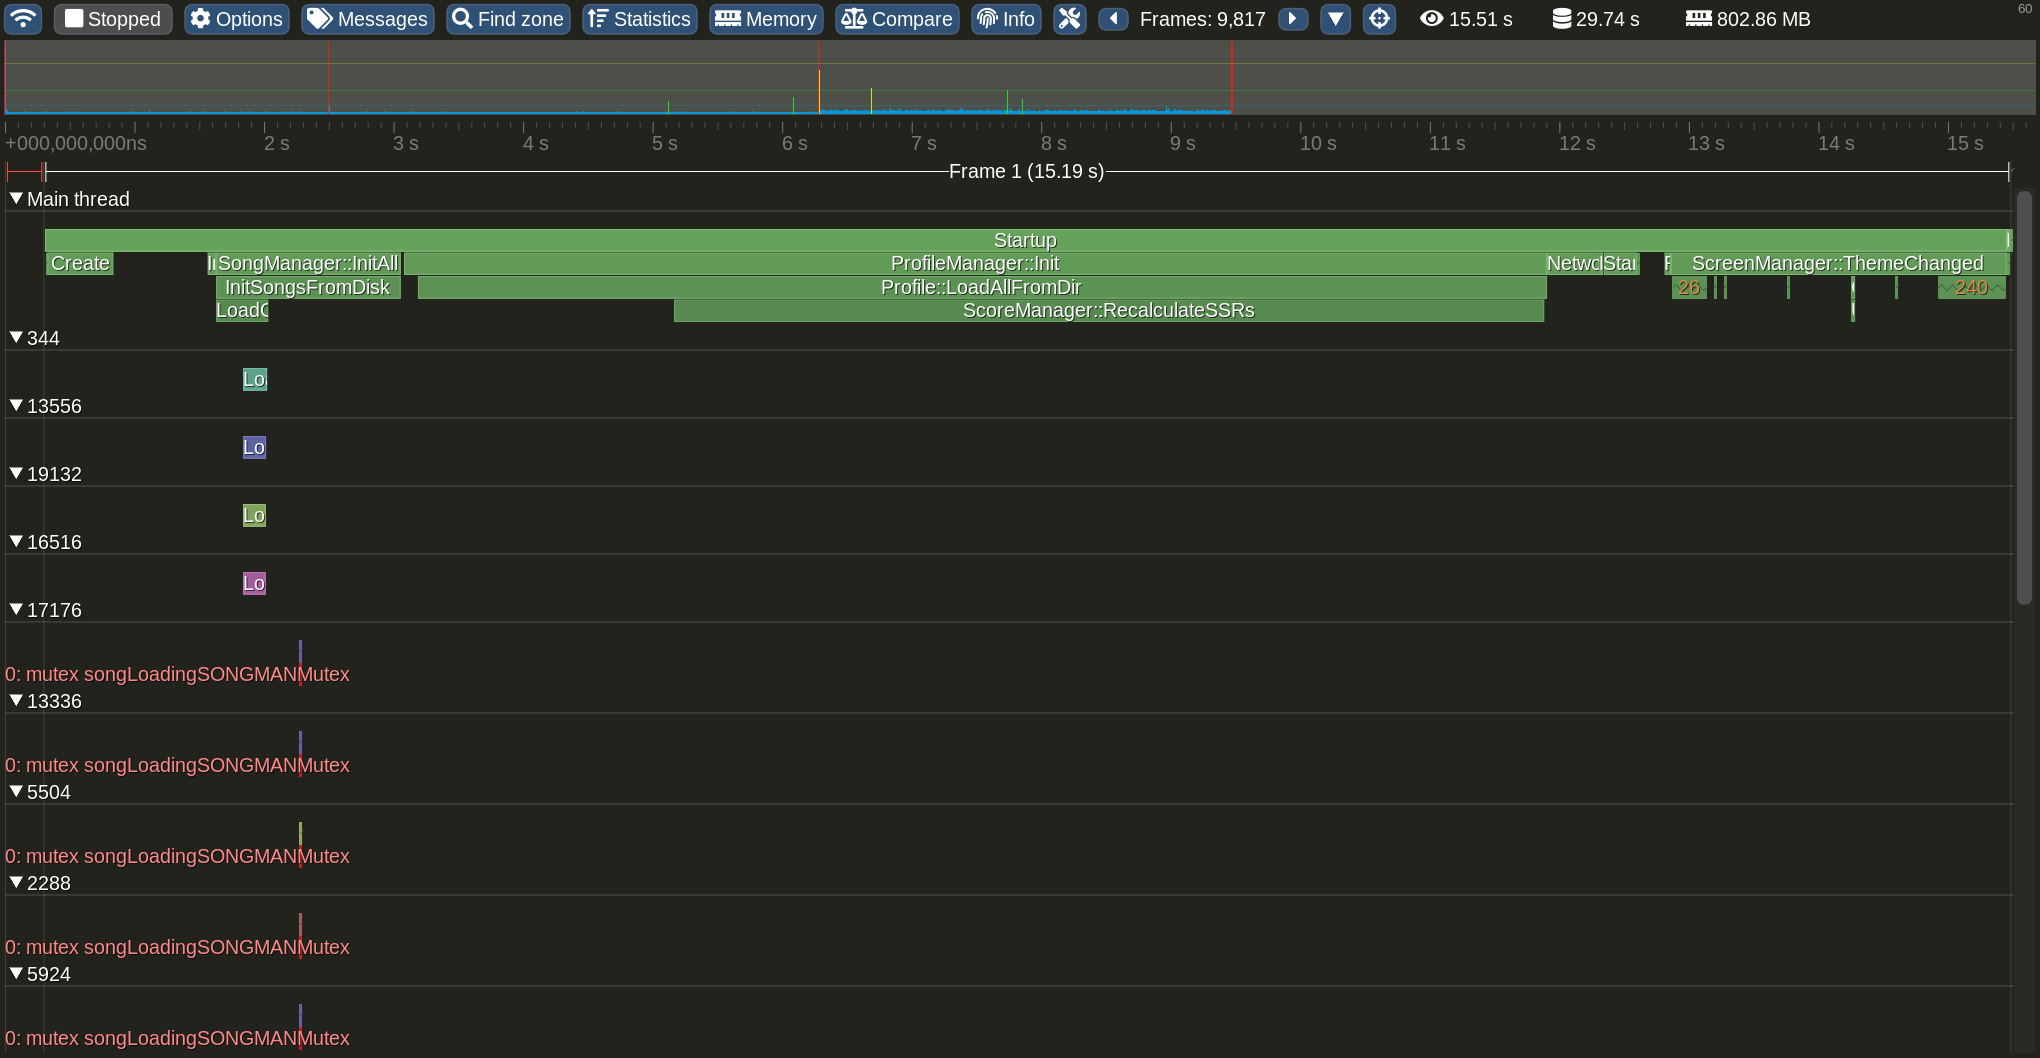
It also supports "messages", which lets one easily find frames where certain events happened. Currently I made it send a message for screen transitions and the chart name when we start gameplay for a chart:
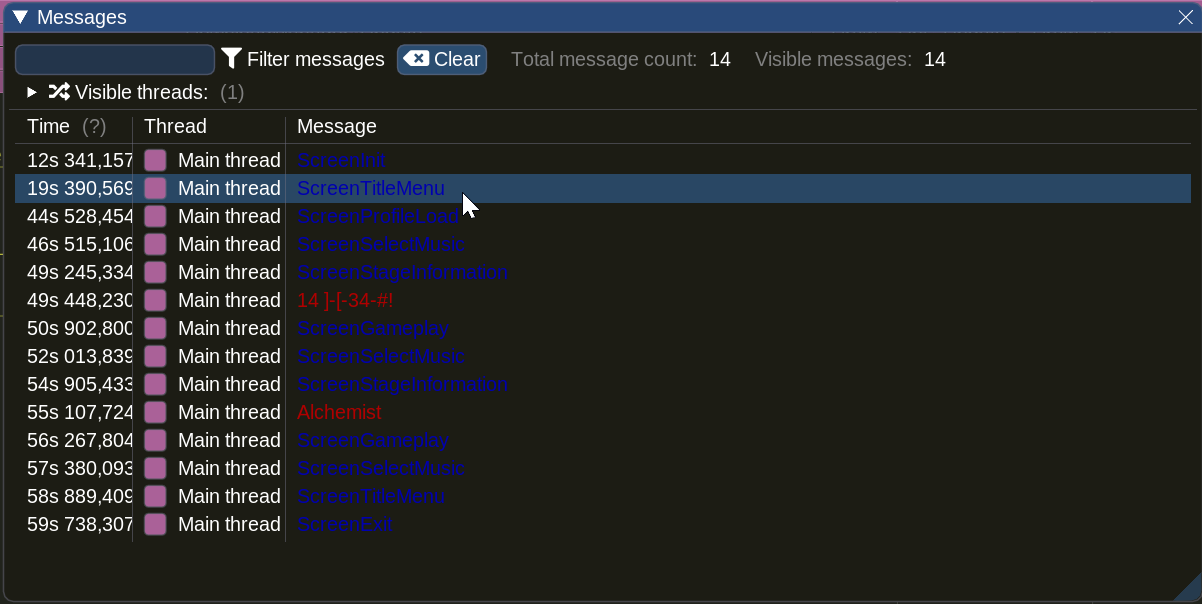
Clicking these takes one to that frame/point in time in the profiler graph.
The only thing linked to the binary is the "TracyClient" which just collects data and sends it to the server/profiler. If the preprocessor definition TRACY_ENABLE is not defined, Tracy should have 0 overhead and not do anything (that is the default, and I made a cmake option to enable it).
To compile the profiler server on windows just open the vs solution in etterna\extern\tracy\profiler\build\win32 and compile it. I'm attaching a zip with the exe I compiled locally (release 64bits) if anyone is too lazy to do it (The .7z files in https://github.com/wolfpld/tracy/releases have windows binaries but that's for the last release, I added master since it has a few more features).
Tracy.zip
It supports remote profiling within a network, but I don't think we will be using that. In the future we could embed the server in the binary to let users generate a profile trace file which they can send to us to analyze locally, but I think that's a pipe dream.
If the profiler is run in administrator mode, it can also show context switches and how much actual execution time each zone had (and check to which other processes we lost cpu time, and it can also show when a thread was moved from one actual cpu core to another).
It can track memory usage and allocations within each profiled zone/area, but that requires overriding the new/delete allocator and replacing malloc/free calls with it's own, which I haven't done in this PR.
Tracy has a fairly comprehensive pdf manual available here: https://github.com/wolfpld/tracy/releases . I recommend reading it at least a bit for anyone looking to use it (At least the "analyzing the captured data" which explains how to navigate the flamegraph and read data. It can show histograms for a bunch of things, and navigating the flamegraph with the mouse is not very intuitive (Navigating it effectively uses all three mouse buttons, same for the frame time graphs))
This PR only adds some basic integration which can improved, by adding more message events, more zones, and adding lua support (Tracy supports lua, it can register a few lua functions which one can call explicitly in lua code to have it show in the profiler output).
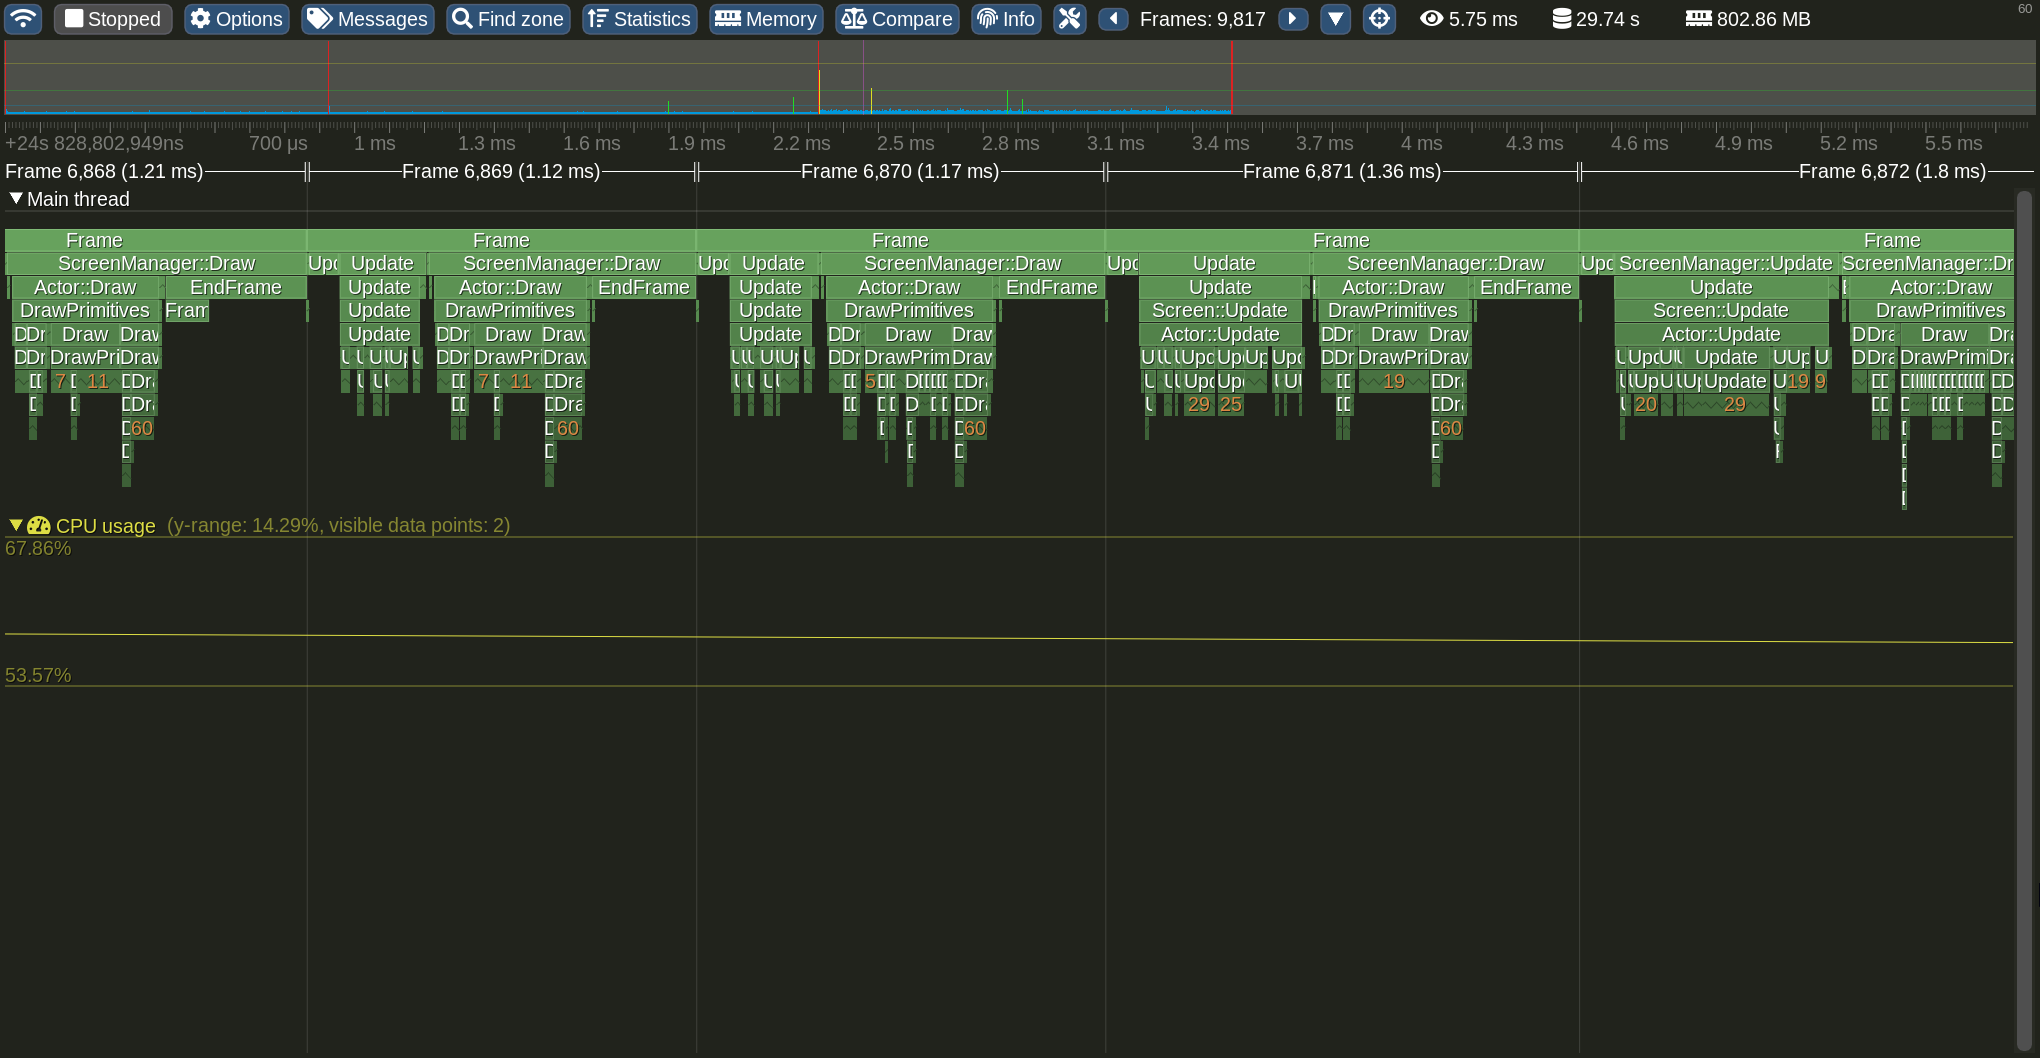
More screenshots:
Some nice benefits of using this compared to a more traditional profiler is that it is frame-aware, and it lets us give a section of code within a function a name and track is separately without having to move it to a separate function. And it supports lua. It also runs on release mode and I found it much nicer to use compared to the sluggish vs profiler (and compared specifically to the vs sampling profiler, it's numbers should be more accurate. Tracy claims to be nanosecond accurate)