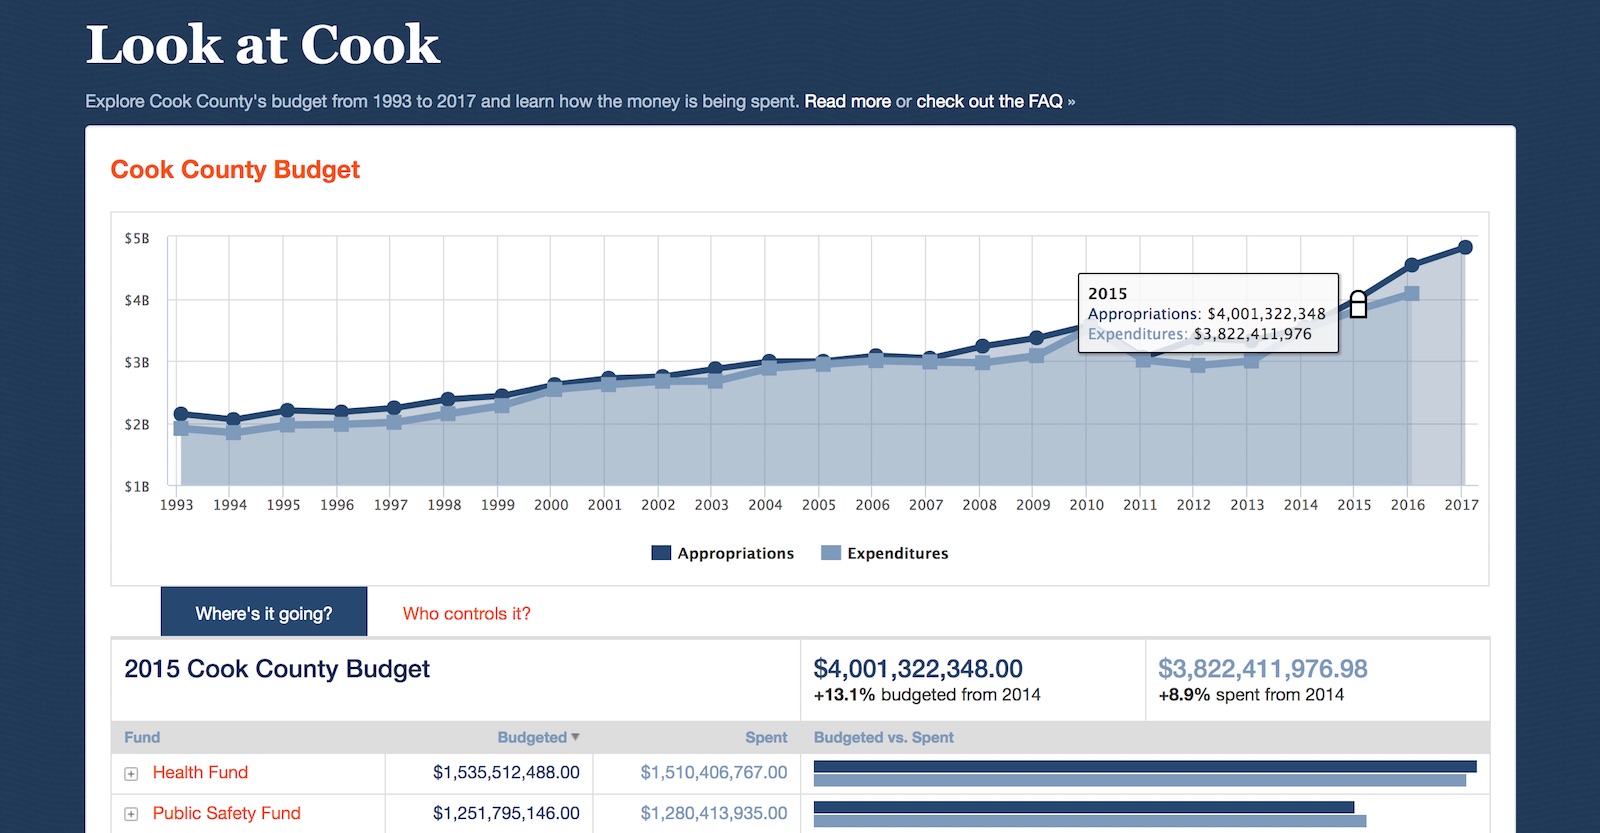
A budget transparency visualization for Cook County, IL (Chicago's county) displaying all county departments broken down by fund and control officer from 1993 to 2017. Originally done as a collaboration with Cook County Commissioner John Fritchey.
- jQuery
- D3 (for CSV manipulation)
- Backbone (javascript MVC framework)
- Highcharts (charting library)
- Datatables (sortable HTML tables)
This code can be customized to visualize another data set. ####Data Prepatation The budget data can be in various forms (csv, google doc, google fusion table), but must adhere to a fixed format in order for the app to process it properly. Budget column headers include: Fund ID, Fund, Results Area, Department ID, Department, Short Title, Link to Website, Department Description, and Control Officer. Values for appropriations and expenditures must be broken down into a separate column for each year.
See examples of prepped data:
####Configuration
- Once the data is prepared, set dataSource in js/app.js to link up to your data.
If your budget data is in CSV form: Drop the csv file in the data folder, and set dataSource to the file path.
If your data is in a google doc: You will first need to publish the google doc to the web as a CSV. Then, set dataSource to the URL provided.
- Next, set the following configuration variables at the top of js/app.js:
- startYear
- endYear
- activeYear
- municipalityName
If something is not behaving intuitively, it is a bug, and should be reported as an issue
You can also email [email protected].
- Fork the project.
- Make your feature addition or bug fix.
- Commit and send me a pull request. Bonus points for topic branches.
Copyright © 2019 DataMade (datamade.us), Derek Eder, Nick Rougeux and Open City. Released under the MIT License.
See LICENSE for details https://raw.githubusercontent.com/datamade/look-at-cook/master/LICENSE.md


