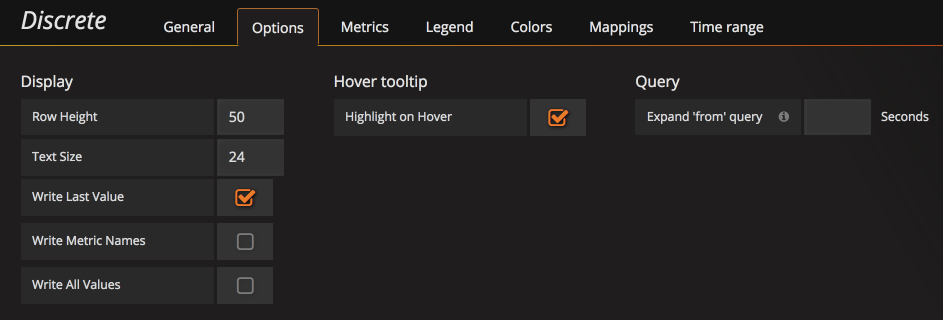
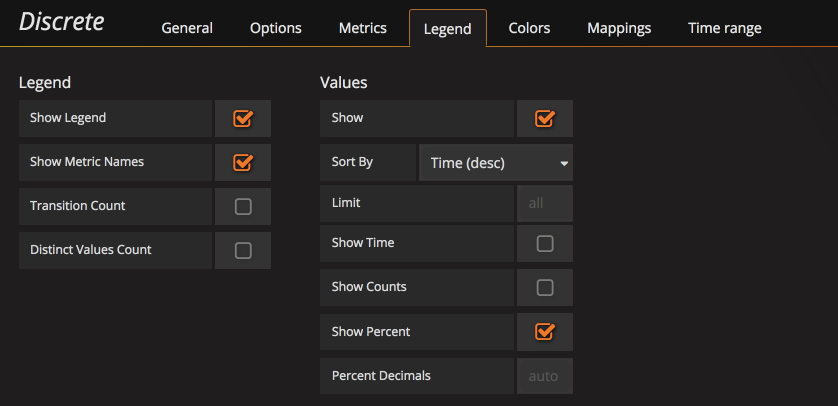
This panel shows discrete values in a horizontal graph. This lets show state transitions clearly. It is a good choice to display string or boolean data
To complie, run:
yarn install
yarn build
- TODO: full annotation support
- TODO: better documentation
- release v1.0
- Remove
distfrom master - Use webpack build
- FIX: Use background color to clear the background
- Configurable duration resolution option (thanks @clink-aaron)
- Support Snapshots (thanks @londonanthonyoleary)
- Direct link rendered image now works.
- Support UTC date display
- Fix display issue with 5.1
- Merge distinct values in legend unless showing the name
- Basic Annotation Support
- Fix mapping numeric data to text
- Switch to typescript
- Override applyPanelTimeOverrides rather than issueQueries to extend time
- Support numeric unit conversion
- New rendering pipeline (thanks @jonyrock)
- Don't detect duplicate colors from metrics
- Formatting with prettier.js
- Only hide hover text when it collides
- Show time axis (copied from novatec-grafana-discrete-panel)
- Improved text collision behavior
- Fix for grafana 4.5 (thanks @alin-amana)
- Support results from the table format
- Support results in ascending or decending order
- Configure legend percentage decimal points
- Legend can show transition count and distinct value count
- Clamp percentage stats within the query time window
- Changed the grafana dependency version to 4.x.x, since 3.x.x was not really supported
- Fixed issues with tooltip hover position
- Option to expand 'from' query so the inital state can avoid 'null'
- Support shared tooltips (not just crosshair)
- Configure more colors (retzkek)
- Fix tooltips (retzkek)
- Configure Text Size
- Support shared crosshair
- Use the panel time shift.
- First working version


