The United States Geological Survey (USGS) was responsible for providing scientific data about natural hazards, the health of ecosystems and the environment, and the impacts of climate and land-use change. Their scientists developed new methods and tools to supply timely, relevant, and useful information about the Earth and its processes.
The USGS was interested in building a new set of tools to visualize their earthquake data. They collected a massive amount of data from all over the world each day, but lacked a meaningful way of displaying it. In this challenge, you were tasked with developing a way to visualize USGS data to help them better educate the public and other government organizations (and hopefully secure more funding) on issues facing our planet. Inside your local Git repository, you created a directory for the Leaflet challenge, using folder names to correspond to the challenges:
The instructions for this activity are broken into two parts:
- Part 1: Create the Earthquake Visualization
- Part 2: Gather and Plot More Data
This challenge used both HTML and JavaScript, so you added all the necessary files. These were the main files for running the analysis.
The first task was to visualize an earthquake dataset by completing the following steps:

-
Used the JSON URL from the USGS GeoJSON Feed to pull in the earthquake dataset. The data included information such as the longitude, latitude, magnitude, and depth of each earthquake.
-
The USGS provideD earthquake data in a number of different formats, updated every 5 minutes. Visited the USGS GeoJSON FeedLinks to an external site.
-
page and choosen a dataset to visualize. The following image is an example screenshot of what appears when you visit this link:

-
When you clicked a dataset (such as "All Earthquakes from the Past 7 Days"), will be given a JSON representation of that data. Used the URL of this JSON to pull in the data for the visualization. The following image is a sampling of earthquake data in JSON format:

- Used the Leaflet.js library to create an interactive map.
- The L.map function was used to initialize the map, and L.tileLayer was used to display the map tiles.
- Each earthquake's location was plotted on the map using its longitude and latitude.
- The L.circleMarker function was used to create data markers for each earthquake.
- The marker's size was determined by the earthquake’s magnitude, with larger magnitudes corresponding to bigger markers.
- The marker’s color was based on the depth of the earthquake. A gradient color scheme was applied, where earthquakes at greater depths were assigned darker colors.
- For each earthquake marker, a popup was added using the bindPopup function. When clicked, the popup displayed details such as the location, magnitude, and depth of the earthquake.
- A legend was added to provide context for the marker colors (depth) and sizes (magnitude). The legend was created using Leaflet's L.control and positioned on the map. It explained the color coding for depth and the size variations based on magnitude.
The final visualization included all earthquake markers plotted with varying sizes and colors, popups with detailed information, and a legend for better understanding of the data on the map.
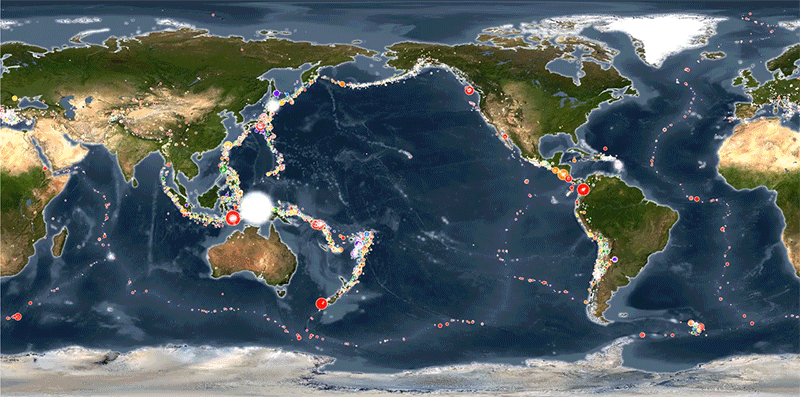
extended the earthquake visualization to include tectonic plates data, giving a clearer view of the relationship between seismic activity and plate boundaries. Here’s how I completed the optional part:


- Used the dataset from the GitHub repository provided, which contains information about tectonic plate boundaries.
- The GeoJSON data for the tectonic plates was pulled and integrated into the map.
- Using Leaflet's L.geoJSON function, added the tectonic plate boundaries to the map as a layer.
- The tectonic plates were displayed as lines representing the boundaries between plates.
- Created two separate layers: one for the earthquakes and another for the tectonic plates. This allowed for better visualization and interaction.
- The L.layerGroup function was used to group the earthquake markers and tectonic plate lines as separate layers.
- Incorporated multiple base map layers to give users different views of the world map.
- Options like satellite view, terrain view, and street view were added using various tile providers such as Mapbox or OpenStreetMap.
- Used L.control.layers to add controls that allowed users to toggle between different base maps and turn on or off the tectonic plates and earthquake layers independently.
- This added interactivity, giving users the ability to focus on either the earthquake data, tectonic plates, or both.
The map now displays both the earthquake markers and the tectonic plate boundaries. Users can switch between different map views and control which layers are visible, providing a comprehensive tool for understanding the relationship between tectonic plates and seismic activity.