prime_exporter is a fork of tbenz9's sia_exporter.
In short, this application feeds ScPrime client data to Prometheus for data
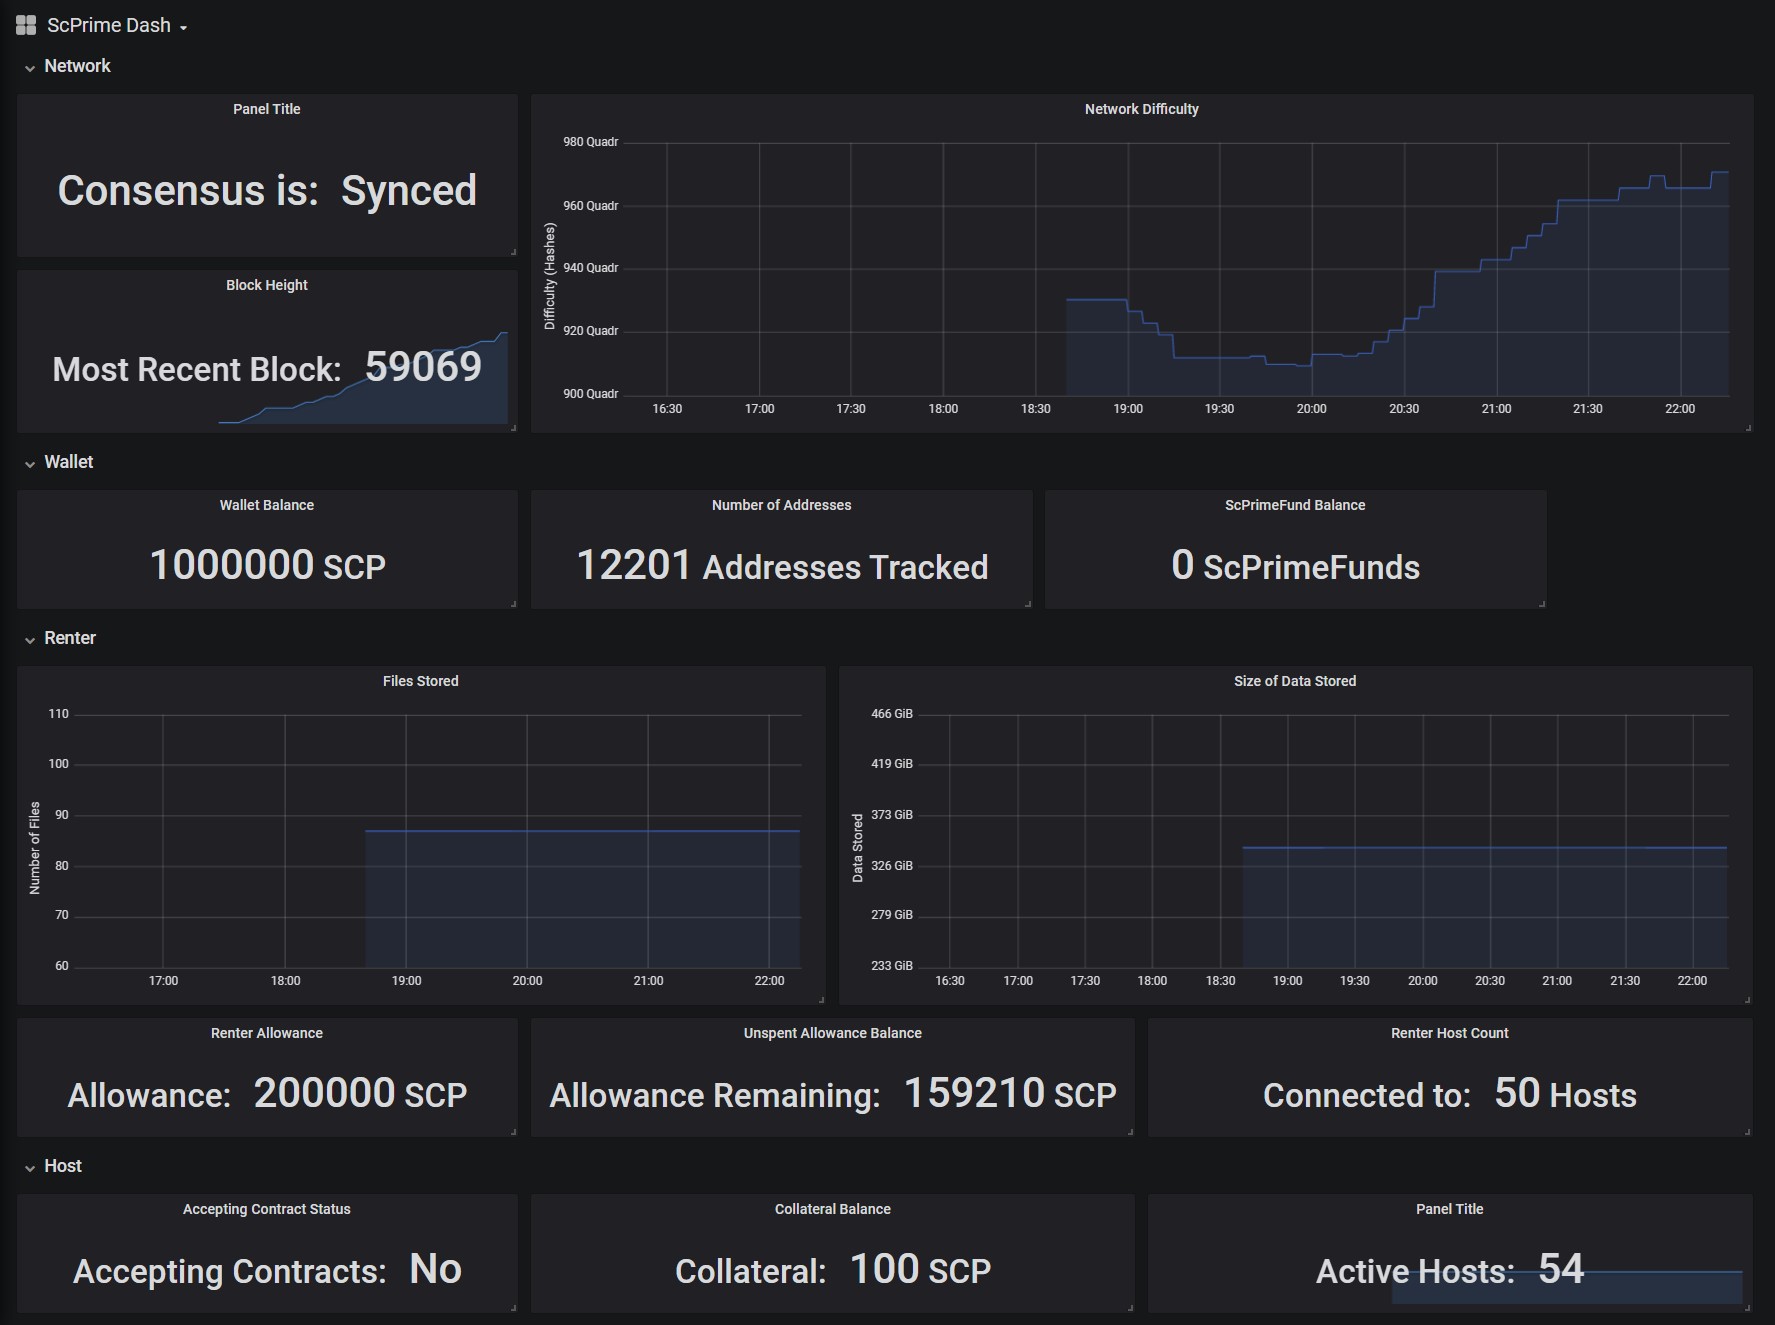
collection, which can then be easily fed to Grafana to make a simple and effective
network and client dashboard.
Prometheus is an extremely popular metric gathering and monitoring solution. Prometheus server scrapes HTTP endpoints at regular intervals and stores that scraped data in a super-efficient database. The result is a highly performant repository of time-series metrics representing whatever data is served by the exporters. Prometheus then presents this data for analysis and display to a variety of other tools such as Grafana.
Grafana is an extremely popular vizualization tool that interfaces with various types of databases, including Prometheus. Here's how they describe themselves. Grafana allows you to query, visualize, alert on and understand your metrics no matter where they are stored. Create, explore, and share dashboards with your team and foster a data driven culture.
prime_exporter queries ScPrime's API and gathers data (metrics), then serves it over
HTTP for Prometheus to consume and Grafana to graph. Prometheus consumes the
data, organizes it into time-series values, which Grafana can then query and
graph. The whole workflow can be broken down into 3step.
- prime_exporter queries the ScPrime API and generates a set of metrics for Prometheus to scrape. By default, this happens every 5 minutes (configurable with flags).
- Prometheus server scrapes the metrics from prime_exporter and saves the data into its internal database. The scrape interval can be customized, but I recommend the same 5 minutes that the prime_exporter is being updated.
- Grafana queries Prometheus for the data, then graphs it in customizable, beautiful graphs. Grafana can also generate alerts, such as emails, when certain conditions are met.
prime_exporter can be found on GitHub at
https://github.com/MasterHW/prime_exporter/releases/.
Simply download the executable and run it on the same system as your ScPrime instance.
prime_exporter is a command-line tool and should be ready to use straight out of
the box for most users.
$> ./prime_exporter
INFO[0000] Beginning to metrics at http://<your ip address>:4283/metrics
For more advanced users prime_exporter does have a number of command-line flags to turn functionality on/off, adjust options, and access a remote ScPrime instance.
$> ./prime_exporter -h
Usage of ./prime_exporter:
  -address string
        ScPrime's API address (default "127.0.0.1:4280")
  -agent string
        ScPrime agent (default "Sia-Agent")
  -debug
        Enable debug mode. Warning: generates a lot of output.
  -modules string
        ScPrime Modules to monitor (default "cghmrtw")
  -port int
        Port to serve Prometheus Metrics on (default 4283)
  -refresh int
        Frequency to get Metrics from ScPrime (minutes) (default 5)
After installing prometheus (guide here
https://prometheus.io/docs/prometheus/latest/getting_started/), configure your
prometheus.yaml file to scrape the new prime_exporter metrics.
Below is a sample prometheus.yaml file scraping a single prime_exporter
endpoint. Don't forget to change the IP address to the IP address of the node
running prime_exporter.
$> cat /etc/prometheus/prometheus.yaml
global:
        scrape_interval: 300s
scrape_configs:
        - job_name: 'prime_exporter'
          metrics_path: /metrics
          static_configs:
                  - targets: ['<localhost/your ip address>:4283']
Now log in to the Prometheus and verify its successfully scraping the prime_exporter metrics (for local instances, simply http://localhost:9090/metrics).

Now install Grafana (guide here https://grafana.com/docs/grafana/latest/guides/getting_started/).
Note: changing http_port to 8080 in custom.ini is useful for initial setup.
If local instance, visit http://localhost:8080/ and begin configuring a new Prometheus data
source (http://localhost:9090 will be the default URL for Prometheus).
For the dashboard, a sample ScPrime Grafana dashboard is available here: https://grafana.com/grafana/dashboards/11410
To use the dashboard, head to the Dashboard import tab (http://localhost:8080/dashboard/import)
and copy the tag 11410 in to the Grafana.com Dashboard section.

Verify that prime_exporter is gathering metrics and serving them over HTTP. This
step verifies that prime_exporter is working as expected. If on a local instance,
simply visit http://localhost:4283/metrics in browser and verify that numbers being
reported are sensical (ex. consensus_height is > 55,000).
If an external instance, enter your private IP address of the node running prime_exporter
wherever <your ip address> is shown.
$> curl -s http://<your ip address>:4283/metrics
# HELP consensus_difficulty Consensus difficulty
# TYPE consensus_difficulty gauge
consensus_difficulty 1.0224573036547688e+18
# HELP consensus_height Consensus block height
# TYPE consensus_height gauge
consensus_height 59082
# HELP consensus_module_loaded Is the consensus module loaded. 0=not loaded.
1=loaded
# TYPE consensus_module_loaded gauge
consensus_module_loaded 1
# HELP consensus_synced Consensus sync status, 0=not synced.  1=synced
# TYPE consensus_synced gauge
consensus_synced 1

... truncated
Prometheus is designed to scrape thousands of endpoints quickly if you have
multiple ScPrime instances running in your network you can install prime_exporter on
each of them and scrape them from a single Prometheus server. For example,
suppose you manage 10 ScPrime wallets, you could easily graph the balance of all 10
wallets on a single chart, and send an email alert when the balance gets too low
on any single wallet.

Suppose you have 100 ScPrime instances and want to ensure they all have the correct
block height, simply set up prime_exporter for all 100 ScPrime instances and graph
the block height. Turn the chart red or send an alert if one of the block
heights is different than the others.
Grafana also integrates seamlessly with alerting tools such as PagerDuty, and AlertManager for more advanced alert use cases. It also offers cool features such as "kiosk" mode to keep your favorite dashboards on display in a public way. Got an extra tablet lying around, set it up to display your ScPrime status, wallet balance, free space, number of uploaded files, etc.
I like making software that works; if you run in to issues, please open an issue and include as much information on your problem and system environment as you can. If you're feeling extra helpful, contribute by opening a pull request, or sharing ideas in the comments.
Contact me on Discord @MasterHW#3493, or the original author @tbenz9#2796.
Siacoin (SC) donation for original author:
f63f6c5663efd3dcee50eb28ba520661b1cd68c3fe3e09bb16355d0c11523eebef454689d8cf