Pipeline Visualization
Text logging is not a convenient for performance simulation. Instead, time-based pipeline diagrams may be dumped and rendered.
Feature of pipeline diagram is not mainlined yet. Now, you have to checkout json branch of MIPT-V:
git checkout jsonand rebuild simulator tool. Then, use -j command line option to generate output file logs.json.
Checkout and build PipelineVis tool according to README instructions. Open logs.json from File->Upload Log, and you'll get diagram similar to that:
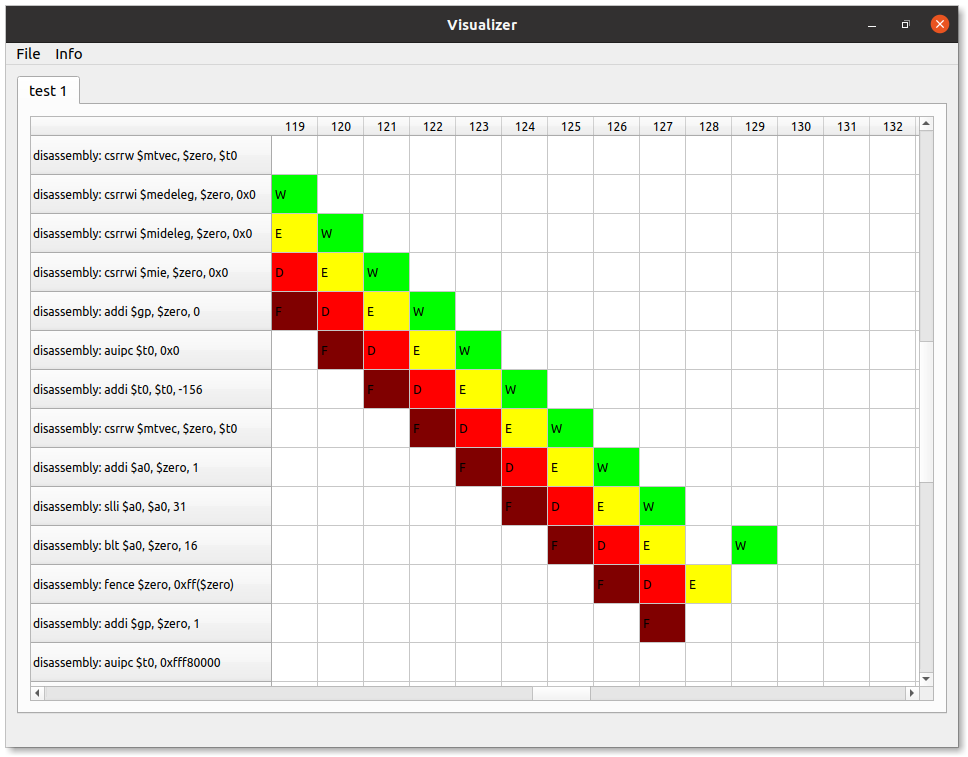
Use scroll bars to navigate between instructions and cycles, and mouse wheel to zoom in and out.