You signed in with another tab or window. Reload to refresh your session.You signed out in another tab or window. Reload to refresh your session.You switched accounts on another tab or window. Reload to refresh your session.Dismiss alert
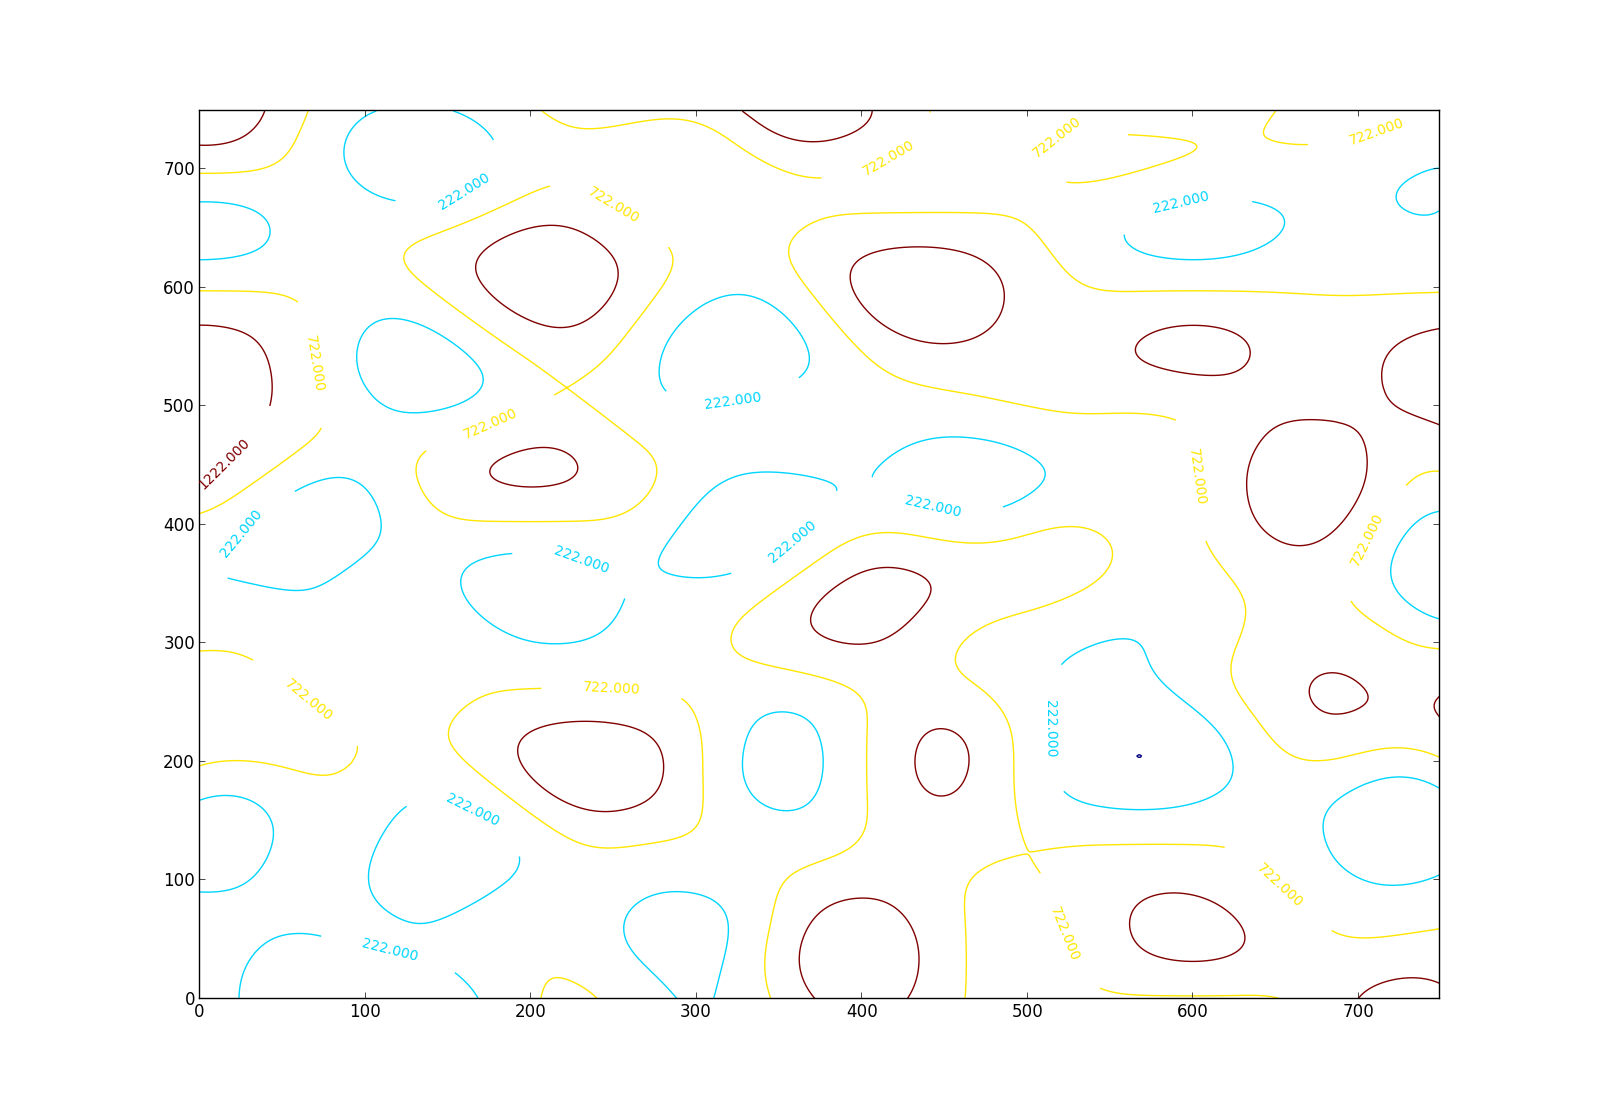
Heightmaps will be visualized with a matplotlib contour plot.
Example:
The above is a 750x750 map. There isn't a lot of variation, but the map is very small and and smoothness and scaling parameters are still poorly understood.
The text was updated successfully, but these errors were encountered:
Heightmaps will be visualized with a matplotlib contour plot.

Example:
The above is a 750x750 map. There isn't a lot of variation, but the map is very small and and smoothness and scaling parameters are still poorly understood.
The text was updated successfully, but these errors were encountered: