This step-by-step tutorial helps you deploy the Kubernetes Fury Distribution (KFD) on a local Kubernetes cluster based on Talos Linux.
Talos Linux is Linux designed for Kubernetes: secure, immutable, and minimal.
- Supports cloud platforms, bare metal, and virtualization platforms
- All system management is done via an API. No SSH, shell or console
- Production ready: supports some of the largest Kubernetes clusters in the world
- Open source project from the team at Sidero Labs
Talos Linux can run on several other platforms, this tutorial is a quick start on a local environment, but you can apply the same steps to deploy KFD on other types of Talos installations. Refer to Talos Official Documentation for more details.
This tutorial will cover the following topics:
- Local Kubernetes cluster creation with Talos
- Download the latest version of KFD with
furyctl - Customize the KFD
- Install the KFD
- Explore some of the Features
- Teardown the environment
☁️ If you prefer trying Fury in a cloud environment, check out the Fury on EKS tutorial or the Fury on GKE tutorial.
This tutorial assumes basic familiarity with Kubernetes, Docker and Talos Linux.
To follow this tutorial you will need:
- Docker
talosctlwill use Docker to create the Kubernetes cluster. The tutorial uses a container image containingfuryctland all the necessary tools for simplicity. You can use the same tools from your local machine if you prefer.
talosctl >= v1.0.5
-
Open a terminal
-
Clone the fury getting started repository containing all the example code used in this tutorial:
git clone https://github.com/sighupio/fury-getting-started/ cd fury-getting-started/fury-on-talos -
Download
talosctlFor
amd64architectures:curl -Lo /usr/local/bin/talosctl https://github.com/siderolabs/talos/releases/download/v1.0.5/talosctl-$(uname -s | tr "[:upper:]" "[:lower:]")-amd64 chmod +x /usr/local/bin/talosctlFor Linux and darwin operating systems
talosctlis also available for thearm64processor architecture:curl -Lo /usr/local/bin/talosctl https://github.com/siderolabs/talos/releases/download/v1.0.5/talosctl-$(uname -s | tr "[:upper:]" "[:lower:]")-arm64 chmod +x /usr/local/bin/talosctlSee the offcial documentation for talosctl for more details.
You are all set to start the tutorial 🚀
talosctl cluster create by default creates a 2 node cluster, 1 node for the master (control-plane) and 1 node for the worker. Both of them run as containers within Docker.
For this tutorial we won't use the default cluster creation command, we will need to use some custom flags:
- We will pin the Kubernetes version using the
--kubernetes-versionflag. - The default sizing of the worker will not be enough for this tutorial, we need to set the
--cpus-workersand--memory-workersflags. - We will be using the Ingress module, we need to expose some ports using the
--exposed-portsflag. - We will need storage for some components of the distribution, Talos does not include one by default. We will use Rancher's
local-pathstorage provider, but for it to work we need to patch the worker's configuration with the--config-patch-workerflag. The patch looks like this:
- op: replace
  path: /machine/kubelet/extraMounts
  value:
    - destination: /opt/local-path-provisioner
      type: bind
      source: /opt/local-path-provisioner
      options:
        - bind
        - rshared
        - rw
ℹ️ You don't need to copy the content, the patch is already in the file
talos-worker-patch.yamlof this tutorial repository that you have cloned.
Considering the previous requirements, we can proceed to the first step: the cluster creation.
-
Create the Talos Cluster using the flags mentioned before:
talosctl cluster create --kubernetes-version 1.23.6 --cpus-workers 4 --memory-workers 4096 --exposed-ports 31080:31080/tcp,31443:31443/tcp --config-patch-worker @infrastructure/ talos-worker-patch.yaml
Expected output:
validating CIDR and reserving IPs
generating PKI and tokens
creating network talos-default
creating master nodes
creating worker nodes
waiting for API
bootstrapping cluster
waiting for etcd to be healthy: OK
waiting for apid to be ready: OK
waiting for kubelet to be healthy: OK
waiting for all nodes to finish boot sequence: OK
waiting for all k8s nodes to report: OK
waiting for all k8s nodes to report ready: OK
waiting for all control plane components to be ready: OK
waiting for kube-proxy to report ready: OK
waiting for coredns to report ready: OK
waiting for all k8s nodes to report schedulable: OK

merging kubeconfig into "/Users/ralgozino/.kube/config"
PROVISIONER       docker
NAME              talos-default
NETWORK NAME      talos-default
NETWORK CIDR      10.5.0.0/24
NETWORK GATEWAY   10.5.0.1
NETWORK MTU       1500

NODES:

NAME                      TYPE           IP         CPU    RAM      DISK
/talos-default-master-1   controlplane   10.5.0.2   2.00   2.1 GB   -
/talos-default-worker-1   worker         10.5.0.3   4.00   4.3 GB   -
-
By default
talosctlwill add a new context to your current kubeconfig. For simplicity, let's export the kubeconfig to a file in theinfrastructurefolder:talosctl --nodes 10.5.0.2 kubeconfig infrastructure/
⚠️ Make sure to use the master's IP as the --nodes flag value in the previous command -
Run the
fury-getting-starteddocker image:docker run -ti --rm \ -v $PWD:/demo \ --env KUBECONFIG=/demo/infrastructure/kubeconfig \ --net=host \ registry.sighup.io/delivery/fury-getting-startedℹ️ From now on all commands in this guide assume to be run inside this container unless otherwise specified.
-
Test the connection to the cluster:
kubectl get nodes
Output:
NAME                     STATUS   ROLES                  AGE   VERSION
talos-default-master-1   Ready    control-plane,master   96s   v1.23.6
talos-default-worker-1   Ready    <none>                 92s   v1.23.6
-
Now that we have the cluster up and running, we can install the
local-pathstorage. Run the following command to install it:kubectl apply -f https://raw.githubusercontent.com/rancher/local-path-provisioner/v0.0.22/deploy/local-path-storage.yaml
-
Make the new storage class
local-paththe default one:kubectl patch storageclass local-path -p '{"metadata": {"annotations":{"storageclass.kubernetes.io/is-default-class":"true"}}}' -
Check that the
local-path-storageis working properly.Check the logs, with the following command:
kubectl -n local-path-storage logs -f -l app=local-path-provisioner
you should get something like this:
time="2022-05-26T08:46:13Z" level=debug msg="Applied config: {\"nodePathMap\":[{\"node\":\"DEFAULT_PATH_FOR_NON_LISTED_NODES\",\"paths\":[\"/opt/local-path-provisioner\"]}]}"
time="2022-05-26T08:46:13Z" level=debug msg="Provisioner started"
I0526 08:46:13.142016       1 controller.go:773] Starting provisioner controller rancher.io/local-path_local-path-provisioner-64d5bc6b74-dlqxz_62c217e5-a519-40e5-897b-d82464448012!
I0526 08:46:13.243167       1 controller.go:822] Started provisioner controller rancher.io/local-path_local-path-provisioner-64d5bc6b74-dlqxz_62c217e5-a519-40e5-897b-d82464448012!
In this step we will use furyctl to get the files for the KFD modules.
furyctl, the tool to manage Fury clusters and the Kubernetes Fury Distribution, uses a Furyfile.yml file to specify the modules to download and which version of them.
ℹ️ learn more about
furyctlin the official documentation site
KFD is a modular distribution, you can choose to deploy the parts of it that you need. For this tutorial, we won't use the full distribution but a subset of it because of the limited resources. This won't be a production-grade installation, but you will get an idea of what the distribution offers.
Inspect the provided custom Furyfile.yml located at /demo/Furyfile.yml in the container:
versions:
  monitoring: v1.14.1
  logging: v1.10.2
  ingress: v1.12.2

bases:
  - name: monitoring/prometheus-operator
  - name: monitoring/prometheus-operated
  - name: monitoring/alertmanager-operated
  - name: monitoring/grafana
  - name: monitoring/configs
  - name: monitoring/kube-state-metrics
  - name: monitoring/node-exporter

  - name: logging/elasticsearch-single
  - name: logging/cerebro
  - name: logging/curator
  - name: logging/fluentd
  - name: logging/kibana

  - name: ingress/nginx
  - name: ingress/forecastle
As you can see, we will be using only the Monitoring, Logging, and Ingress modules. There are other modules like OPA for policy enforcement that you can also install and test in this local environment but are left as an excerise to the reader.
ℹ️ Read more about Fury modules in the documentation.
ℹ️ You don't need to write the
Furyfile.ymlfile by hand, can get a fullFuryfile.ymlfile and akustomization.yamlfile for a give4n version of KFD from GitHub releases or, more easily, usingfuryctl:furyctl init --version v1.23.1The command will download the files that you can use as the starting point to configure and deploy the distribution.
⚠️ Don't run this command now, it will overwrite the existingFuryfile.yml
Now that we have a Furyfile.yml, we can proceed to download the modules.
-
Run the following command to download the modules specified by the Furyfile:
cd /demo
furyctl vendor -H
ℹ️ the
-Hflag tellsfuryctlto use HTTP(S) instead of SSH to download the modules from GitHub. -
Inspect the downloaded modules in the
vendorfolder:tree -d /demo/vendor -L 3
Output:
/demo/vendor
└── katalog
    ├── ingress
    │   ├── forecastle
    │   └── nginx
    ├── logging
    │   ├── cerebro
    │   ├── curator
    │   ├── elasticsearch-single
    │   ├── fluentd
    │   └── kibana
    └── monitoring
        ├── alertmanager-operated
        ├── configs
        ├── grafana
        ├── kube-state-metrics
        ├── kubeadm-sm
        ├── node-exporter
        ├── prometheus-operated
        └── prometheus-operator

19 directories
Each module is a Kustomize project. Kustomize allows to group together related Kubernetes resources and combine them to create more complex deployments. Moreover, it is flexible, and it enables a simple patching mechanism for additional customization.
ℹ️ read more about Kustomize in the official documentation.
To deploy the Fury distribution, use the following root kustomization.yaml located /demo/manifests/kustomization.yaml:
apiVersion: kustomize.config.k8s.io/v1beta1
kind: Kustomization
resources:

  # Monitoring
  - ../vendor/katalog/monitoring/prometheus-operator
  - ../vendor/katalog/monitoring/prometheus-operated
  - ../vendor/katalog/monitoring/alertmanager-operated
  - ../vendor/katalog/monitoring/node-exporter
  - ../vendor/katalog/monitoring/kube-state-metrics
  - ../vendor/katalog/monitoring/grafana
  - ../vendor/katalog/monitoring/configs

  # Logging
  - ../vendor/katalog/logging/elasticsearch-single
  - ../vendor/katalog/logging/cerebro
  - ../vendor/katalog/logging/curator
  - ../vendor/katalog/logging/fluentd
  - ../vendor/katalog/logging/kibana

  # Ingress
  - ../vendor/katalog/ingress/nginx
  - ../vendor/katalog/ingress/forecastle

  # Ingress definitions
  - resources/ingress.yml

patchesStrategicMerge:

  - patches/alertmanager-operated-replicas.yml
  - patches/alertmanager-operated-resources.yml
  - patches/prometheus-operated-resources.yml
  - patches/prometheus-operator-resources.yml
  - patches/grafana-resources.yml
  - patches/kibana-resources.yml
  - patches/elasticsearch-resources.yml
  - patches/fluentd-resources.yml
  - patches/fluentbit-resources.yml
  - patches/nginx-ingress-controller-resources.yml
  - patches/nginx-ingress-controller-on-master.yaml
The kustomization.yaml file:
- references the modules downloaded in the previous section
- patches the upstream modules for this tutorial usecase (e.g.
patches/elasticsearch-resources.ymllimits the resources requested by elastic search) - deploys some additional custom resources not included by default in the modules (e.g.
resources/ingress.yml).
Proceed to install the modules into the cluster:
cd /demo/manifests/

make apply
# Due to some chicken-egg 🐓🥚 problem with custom resource definitions, you have to wait for a minute for the API server to register the new objects and then apply again.
make apply🚀 The distribution is finally deployed! In this section you explore some of its features.
In Step 3, alongside the distribution, you have deployed Kubernetes ingresses to expose underlying services at the following HTTP routes:
forecastle.fury.infografana.fury.infokibana.fury.infoalertmanager.fury.infoprometheus.fury.info
If you remember in the first step we created the cluster with some port-forward enabled to reach the ingress controller. To access the ingresses more easily via the browser, configure your local DNS to resolve the ingresses to your machine's IP:
- Add the following line to your local
/etc/hosts:
<YOUR_LOCAL_IP> forecastle.fury.info alertmanager.fury.info grafana.fury.info prometheus.fury.info kibana.fury.infoYou can just put
127.0.0.1as the IP address if you do not know it. The port-forward is enabled for all the IPs in your machine. Remember that you will need to edit thehostsfile asrootmost probably.
Now, you can reach the ingresses directly from your browser on port 31080 for HTTP and on port 31443 for HTTPS.
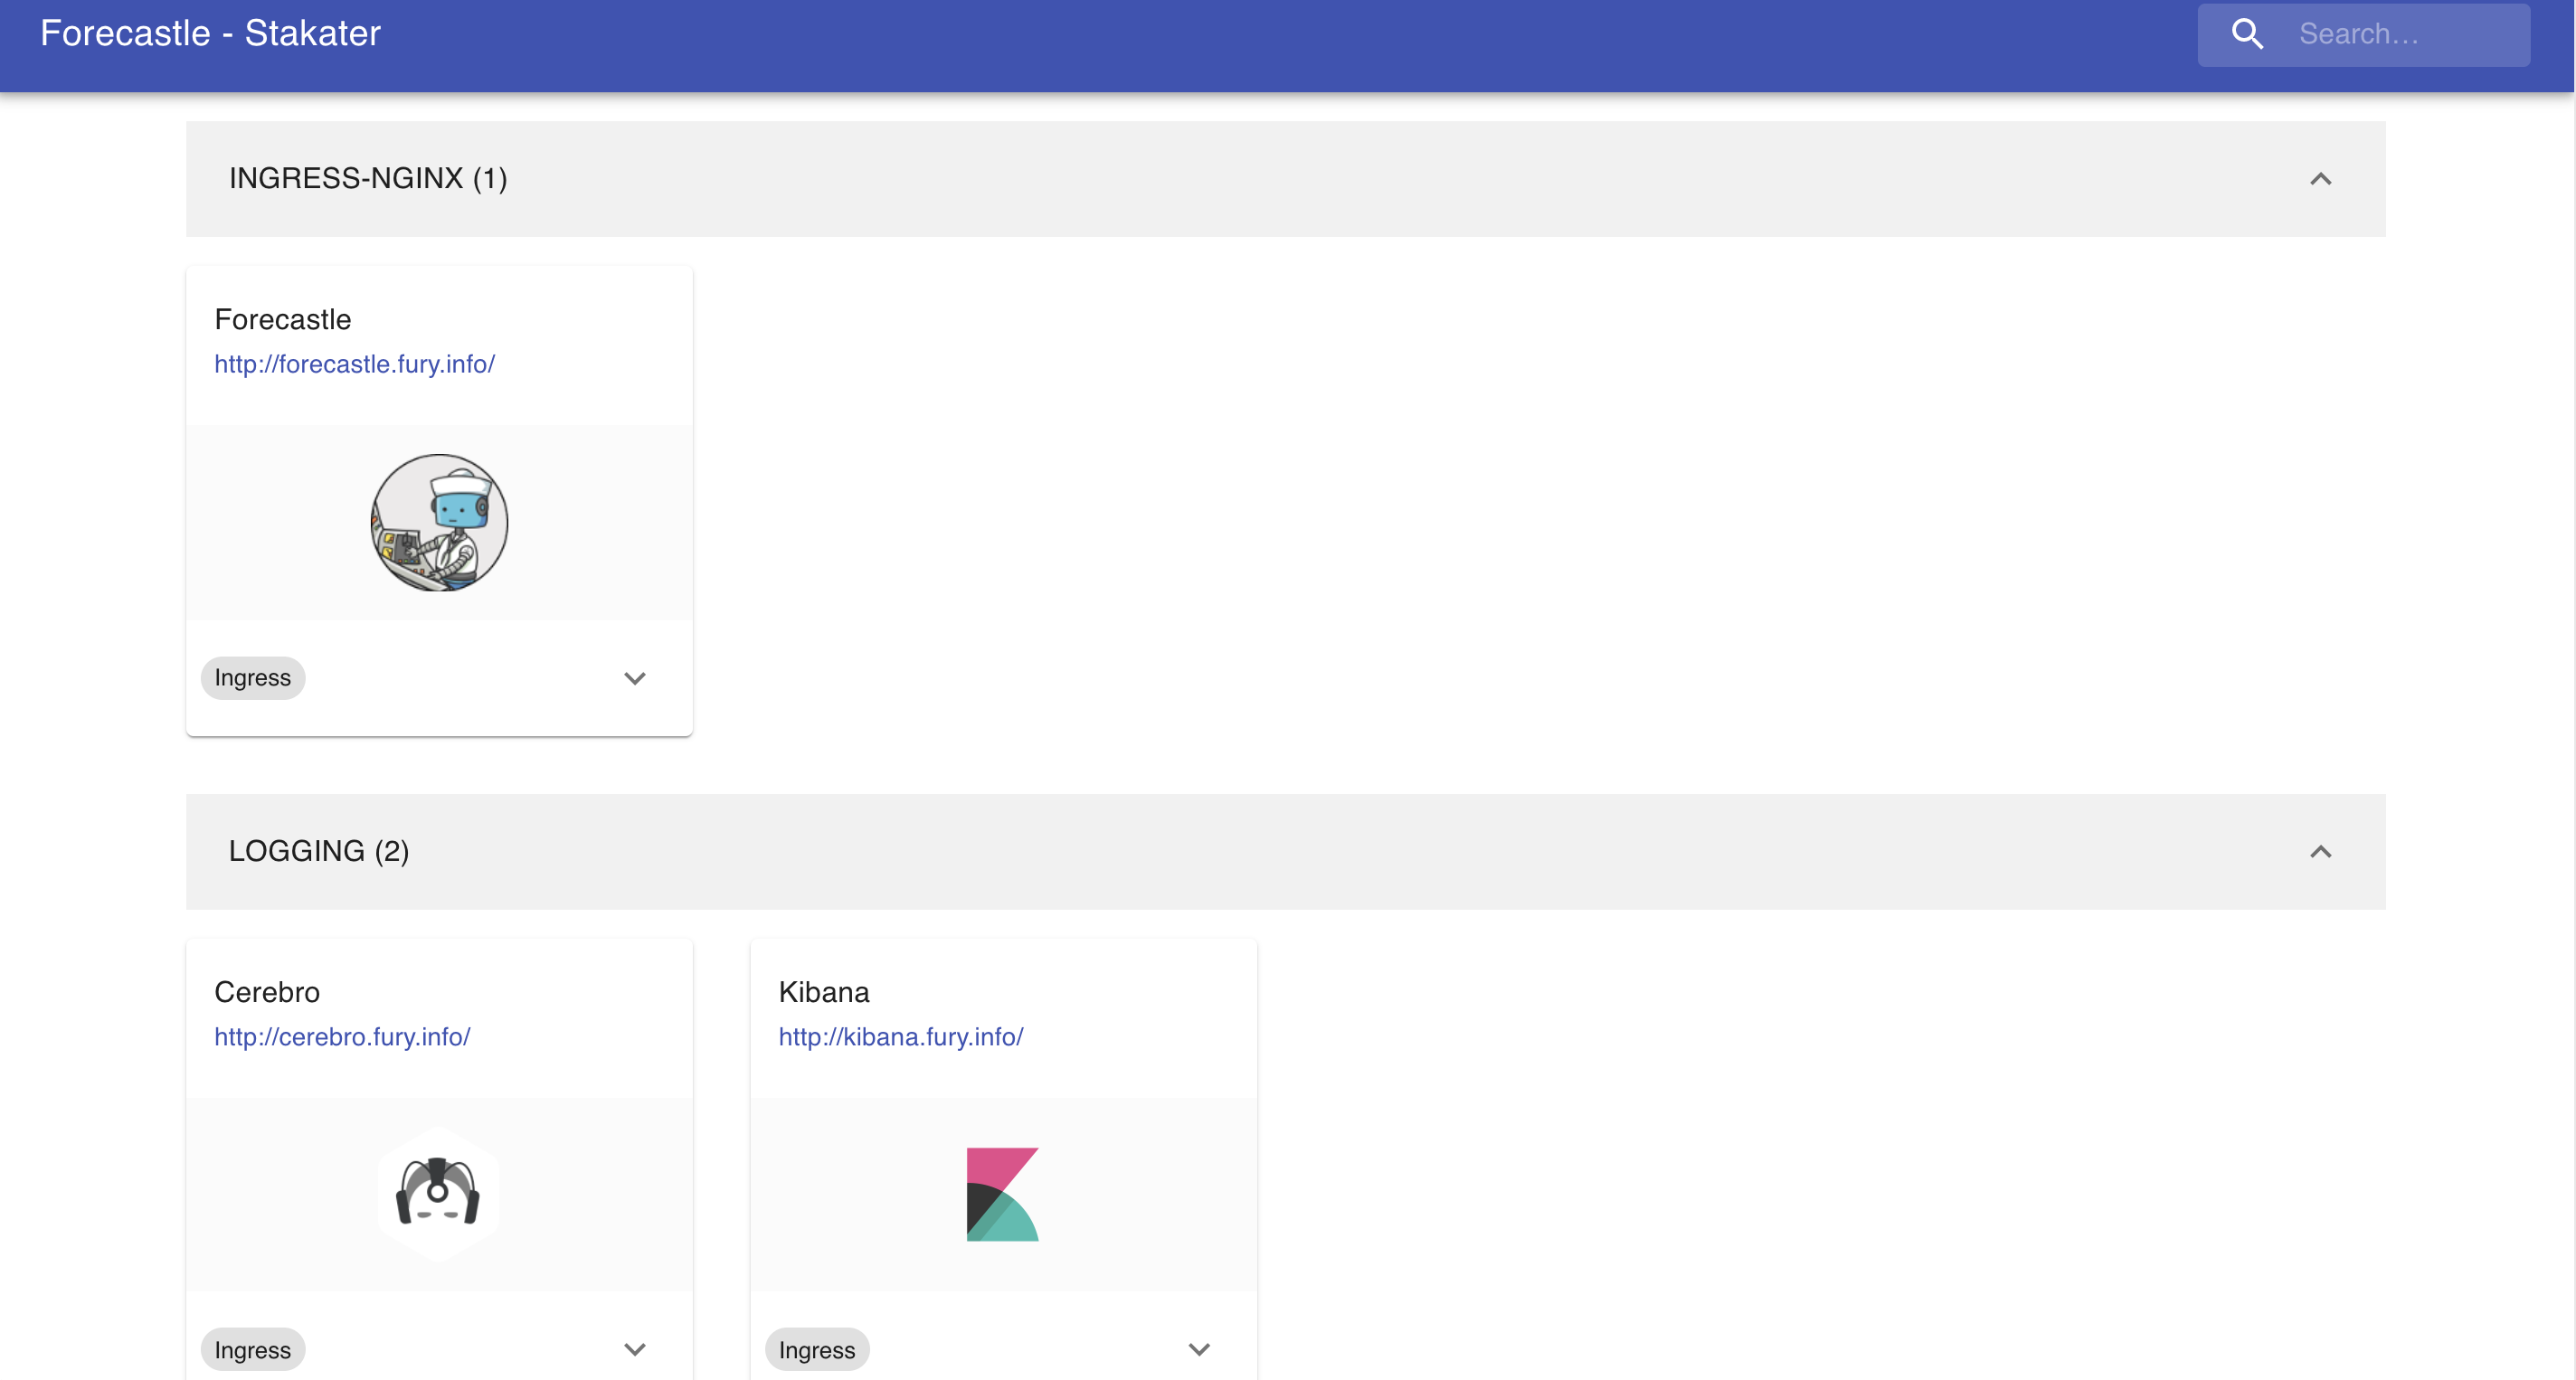
Forecastle is an open-source control panel where you can access all exposed applications running on Kubernetes.
Navigate to http://forecastle.fury.info:31080 to see all the other ingresses deployed, grouped by namespace.
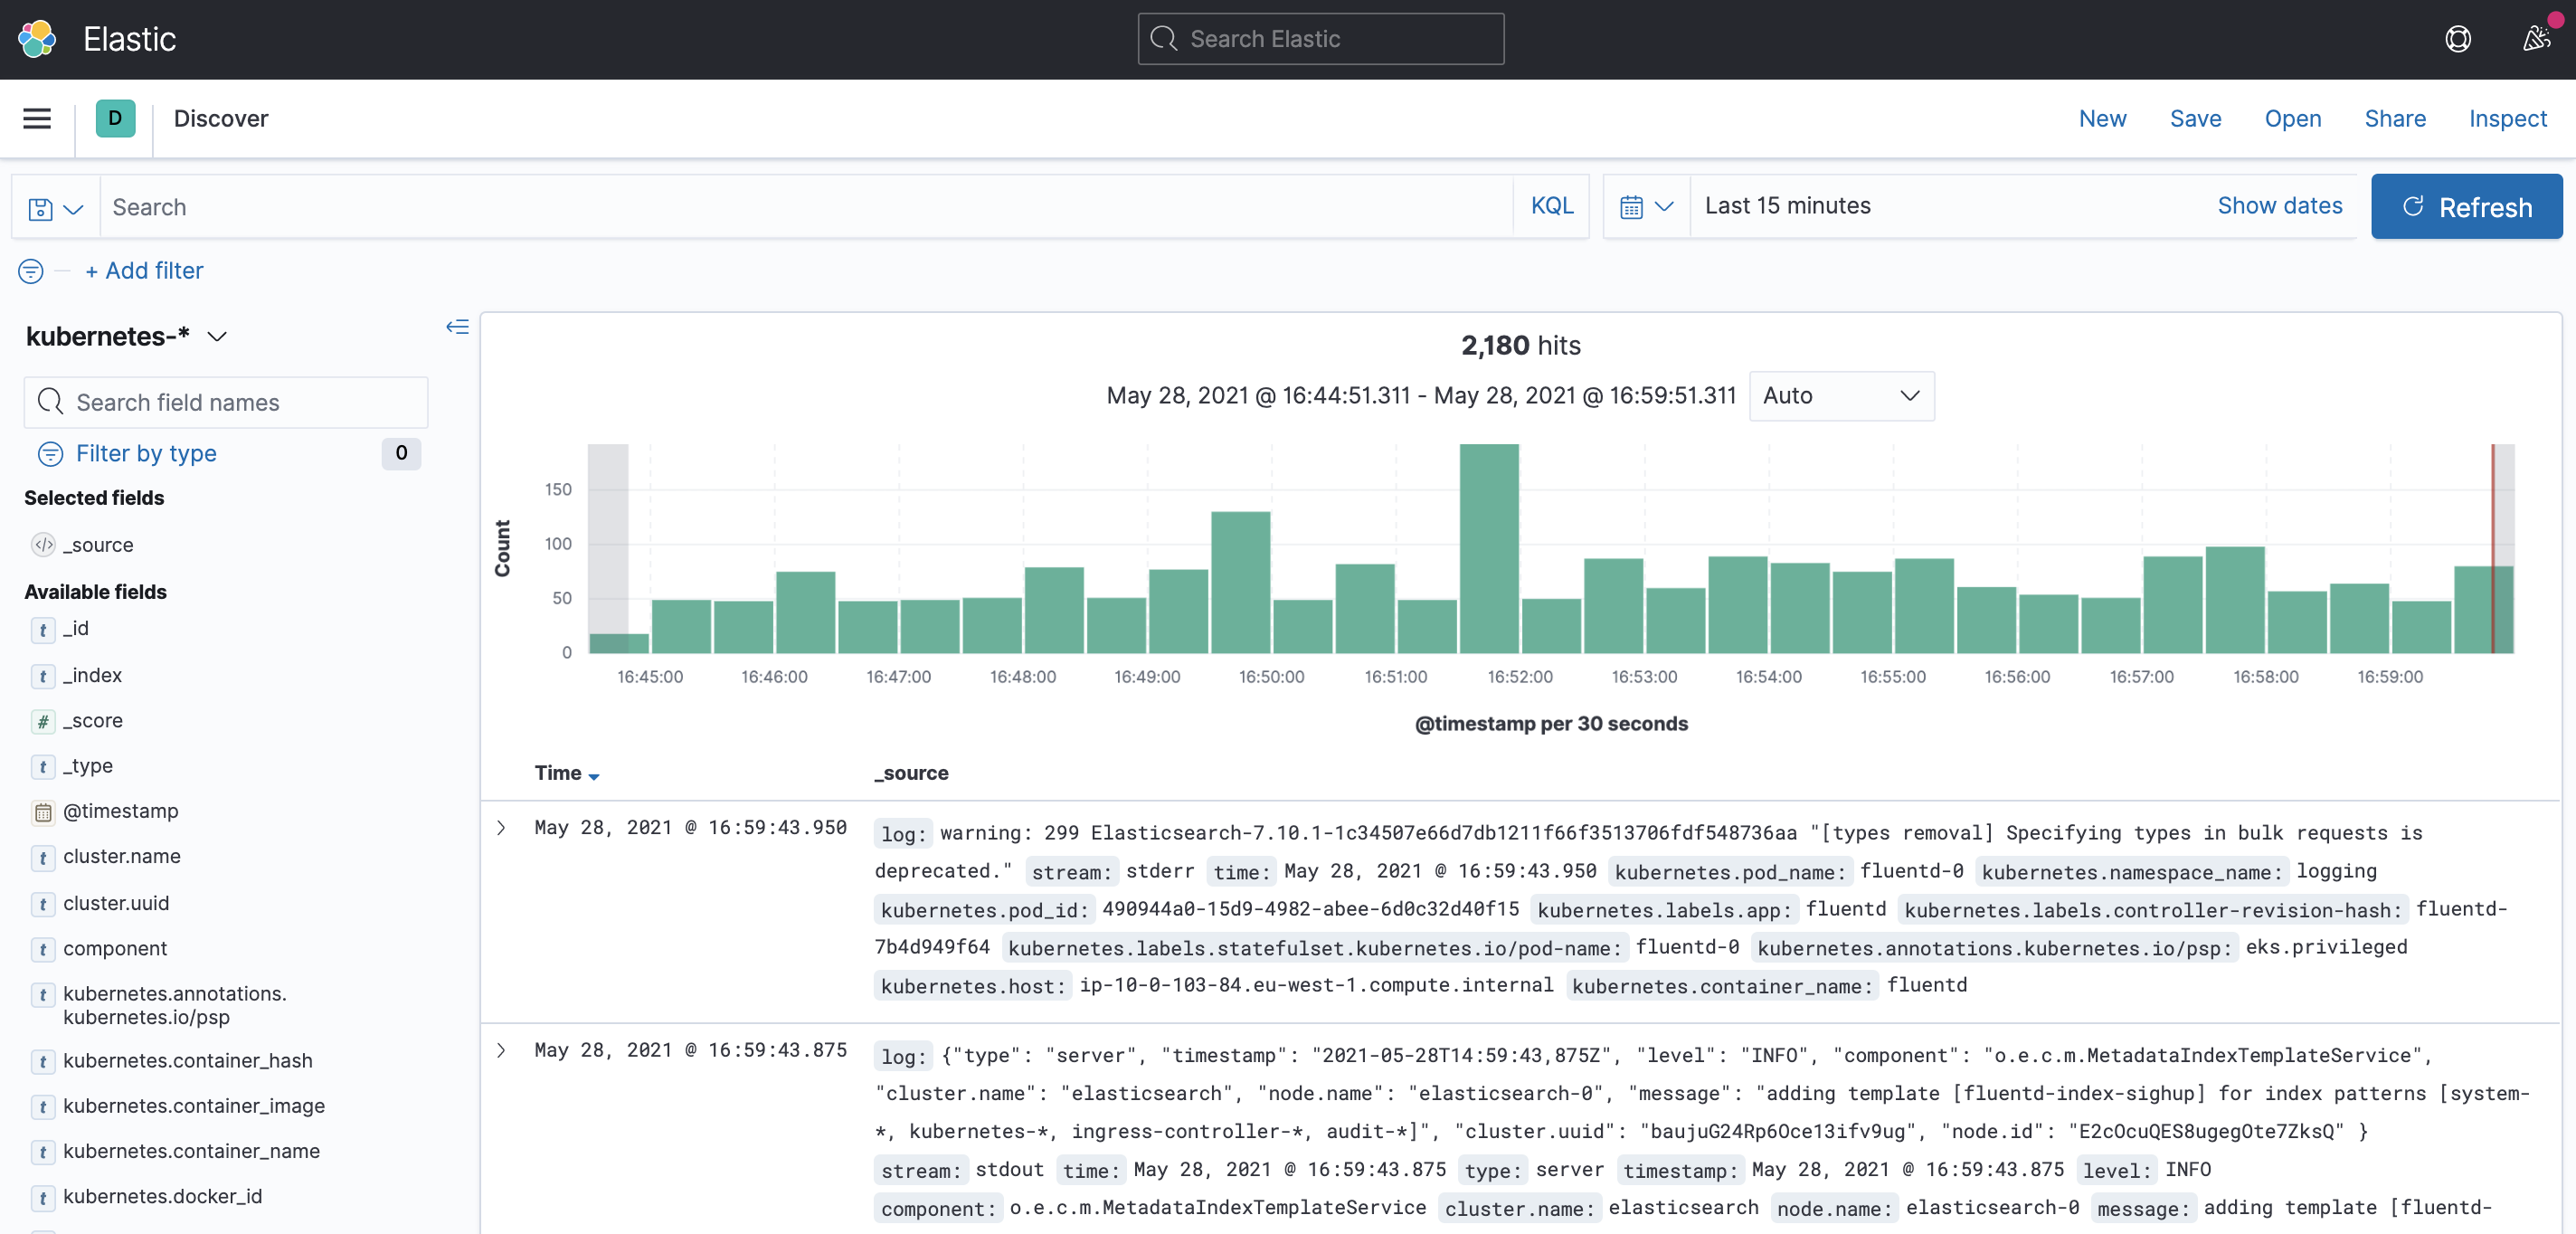
Kibana is an open-source analytics and visualization platform for Elasticsearch. Kibana lets you perform advanced data analysis and visualize data in various charts, tables, and maps. You can use it to search, view, and interact with data stored in Elasticsearch indices.
Navigate to http://kibana.fury.info:31080 or click the Kibana icon from Forecastle.
Click on Explore on my own to see the main dashboard.
- Open the menu on the right-top corner of the page.
- Select
Stack Management(it's on the very bottom of the menu). - Select
Index patternsand click onCreate index pattern. - Click on Show advanced settings and Allow hidden and system indices
- Write
kubernetes-*as index pattern - Select
@timestampas time field. - Click create Index Pattern.
Based on the index you created, you can read and query the logs.
Navigate through the menu again, and select Discover.
Grafana is an open-source platform for monitoring and observability. Grafana allows you to query, visualize, alert on and understand your metrics.
Navigate to http://grafana.fury.info:31080 or click the Grafana icon from Forecastle.
Fury provides some pre-configured dashboard to visualize the state of the cluster. Examine an example dashboard:
- Click on the search icon on the left sidebar.
- Write
podsand click enter. - Select the
Kubernetes/Podsdashboard. - Select a namespace and a pod from the dropdown filters
This is what you should see:

-
Stop the docker container that we've been using to run the commands:
# Execute this command inside the Docker container
exit
-
Delete the talos cluster:
# Execute these commands from your local system, outside the Docker container
talosctl cluster destroy
Congratulations, you made it! 🥳🥳
We hope you enjoyed this tour of Fury!
In case your ran into any problems feel free to open a issue here in GitHub.
More tutorials:
More about Fury: