
![]()
Welcome to EDA Toolkit, a collection of utility functions designed to streamline your exploratory data analysis (EDA) tasks. This repository offers tools for directory management, some data preprocessing, reporting, visualizations, and more, helping you efficiently handle various aspects of data manipulation and analysis.
-
Functions
a. Path Directories
b. Generate Random IDs
c. Trailing Periods
d. Standardized Dates
e. Data Types Reports
f. DataFrame Columns Analysis
g. Summarize All Combinations
h. Save DataFrames to Excel
i. Contingency Table
j. Highlight DataFrame Tables
k. KDE Distribution Plots
l. Stacked Bar Plots with Crosstab Options
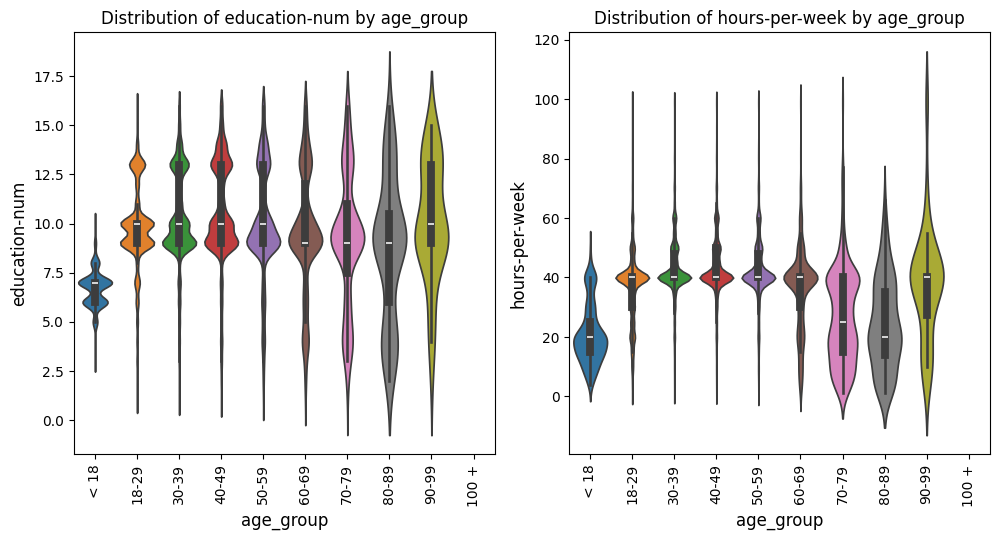
m. Box and Violin Plots
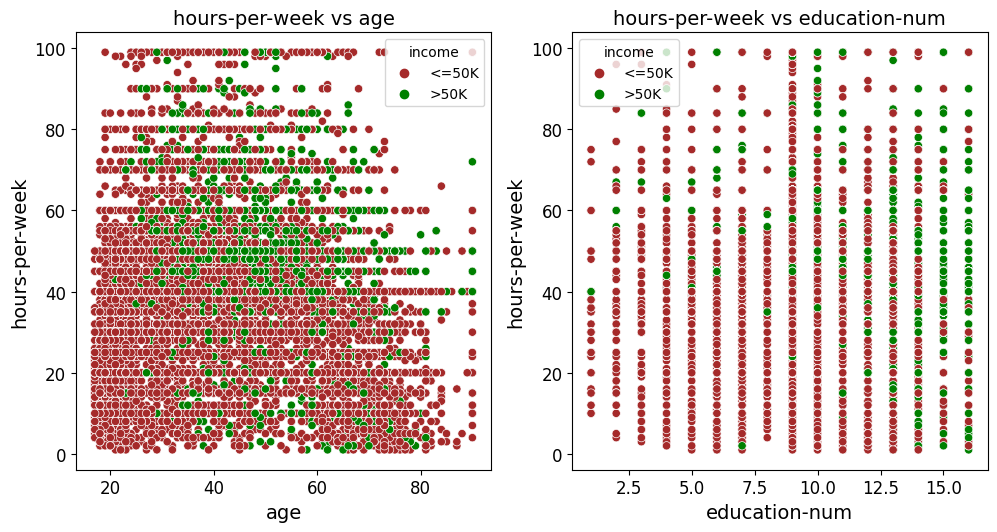
n. Multi-Purpose Scatter Plots
https://lshpaner.github.io/eda_toolkit
Clone the repository and install the necessary dependencies:
pip install eda_toolkitEDA Toolkit is designed to be a comprehensive toolkit for data analysts and data scientists alike. It offers a suite of functions to handle common EDA tasks, making your workflow more efficient and organized. The toolkit covers everything from directory management and ID generation to complex visualizations and data reporting.
Use the Functions as Needed in Your Data Analysis Workflow
ensure_directory(path): Ensures that the specified directory exists; if not, it creates it.
add_ids(df, id_colname="ID", num_digits=9, seed=None, set_as_index=False): Adds a column of unique, 9-digit IDs to a DataFrame.
strip_trailing_period(df, column_name): Strips trailing periods from floats in a specified column of a DataFrame.
parse_date_with_rule(date_str): Parses and standardizes date strings to theISO 8601format (YYYY-MM-DD).
data_types(df): Provides a report on every column in the DataFrame, showing column names, data types, number of nulls, and percentage of nulls.
dataframe_columns(df): Analyzes DataFrame columns for dtype, null counts, max unique values, and their percentages.
summarize_all_combinations(df, variables, data_path, data_name, min_length=2): Generates summary tables for all possible combinations of specified variables in the DataFrame and saves them to an Excel file.
save_dataframes_to_excel(file_path, df_dict, decimal_places=0): Saves multiple DataFrames to separate sheets in an Excel file with customized formatting.
contingency_table(df, cols=None, sort_by=0): Creates a contingency table from one or more columns in a DataFrame, with sorting options.
highlight_columns(df, columns, color="yellow"): Highlights specific columns in a DataFrame with a specified background color.
The following examples utilize the Census Income Data (1994) from the UCI Machine Learning Repository [2]. This dataset provides a rich source of information for demonstrating the functionalities of the eda_toolkit.

Generates stacked or regular bar plots and crosstabs for specified columns.
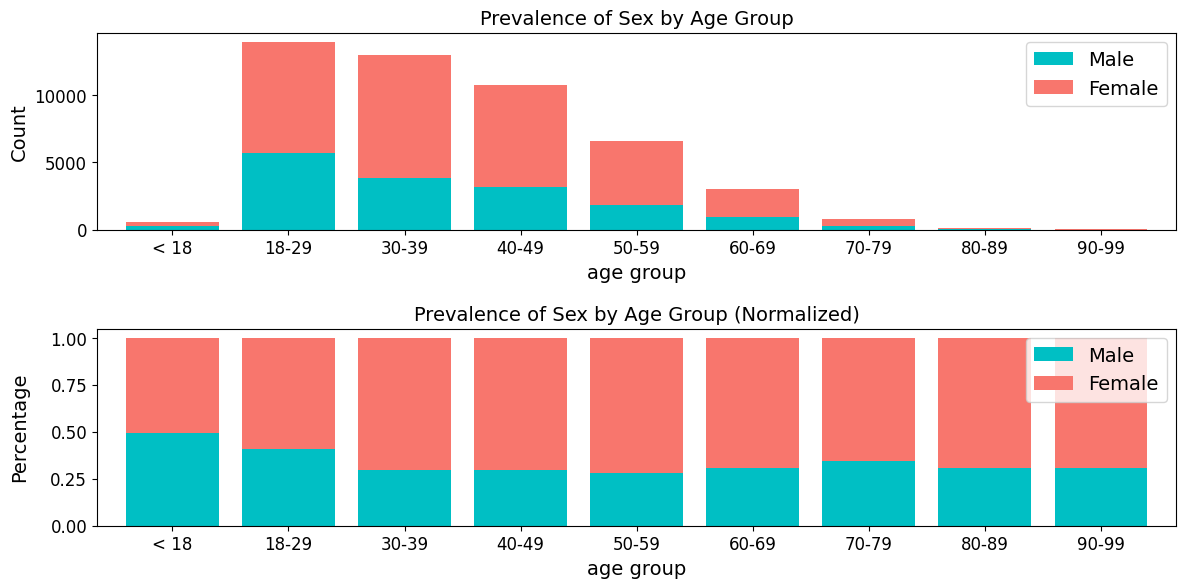
Crosstab for sex
| sex | Female | Male | Total | Female_% | Male_% |
|---|---|---|---|---|---|
| age_group | |||||
| < 18 | 295 | 300 | 595 | 49.58 | 50.42 |
| 18-29 | 5707 | 8213 | 13920 | 41 | 59 |
| 30-39 | 3853 | 9076 | 12929 | 29.8 | 70.2 |
| 40-49 | 3188 | 7536 | 10724 | 29.73 | 70.27 |
| 50-59 | 1873 | 4746 | 6619 | 28.3 | 71.7 |
| 60-69 | 939 | 2115 | 3054 | 30.75 | 69.25 |
| 70-79 | 280 | 535 | 815 | 34.36 | 65.64 |
| 80-89 | 40 | 91 | 131 | 30.53 | 69.47 |
| 90-99 | 17 | 38 | 55 | 30.91 | 69.09 |
| Total | 16192 | 32650 | 48842 | 33.15 | 66.85 |
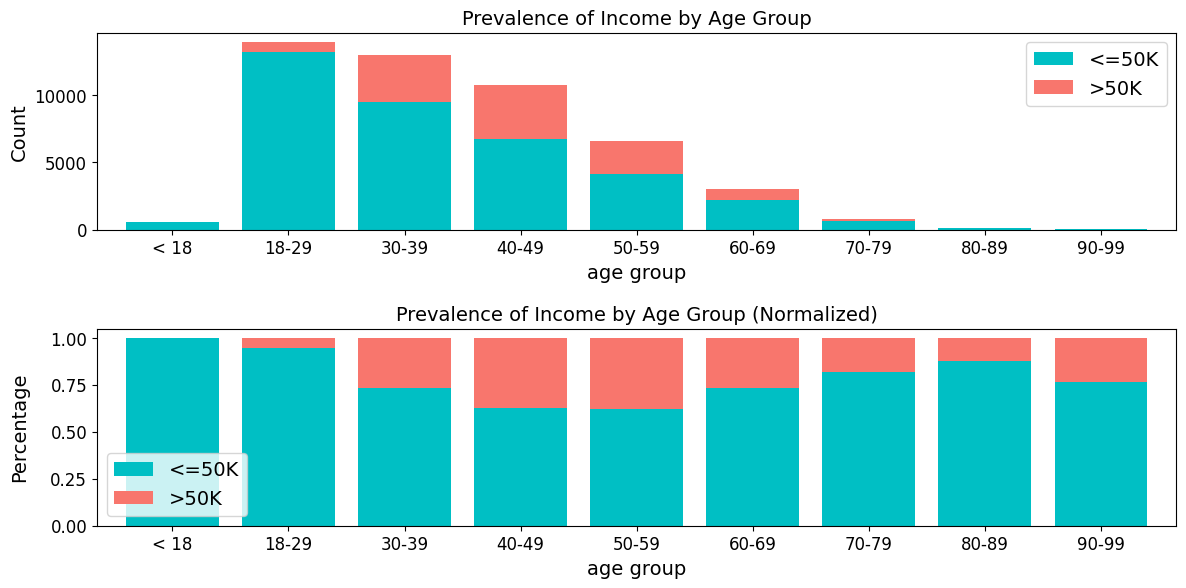
Crosstab for income
| income | <=50K | >50K | Total | <=50K_% | >50K_% |
|---|---|---|---|---|---|
| age_group | |||||
| < 18 | 595 | 0 | 595 | 100 | 0 |
| 18-29 | 13174 | 746 | 13920 | 94.64 | 5.36 |
| 30-39 | 9468 | 3461 | 12929 | 73.23 | 26.77 |
| 40-49 | 6738 | 3986 | 10724 | 62.83 | 37.17 |
| 50-59 | 4110 | 2509 | 6619 | 62.09 | 37.91 |
| 60-69 | 2245 | 809 | 3054 | 73.51 | 26.49 |
| 70-79 | 668 | 147 | 815 | 81.96 | 18.04 |
| 80-89 | 115 | 16 | 131 | 87.79 | 12.21 |
| 90-99 | 42 | 13 | 55 | 76.36 | 23.64 |
| Total | 37155 | 11687 | 48842 | 76.07 | 23.93 |
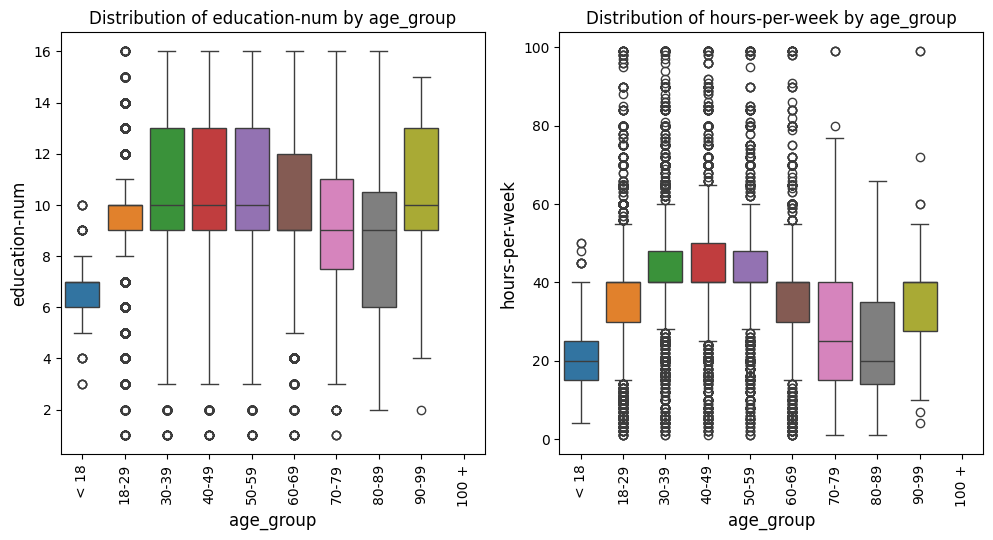
Creates and saves individual boxplots or violin plots, or an entire grid of plots for given metrics and comparisons, with optional axis limits.
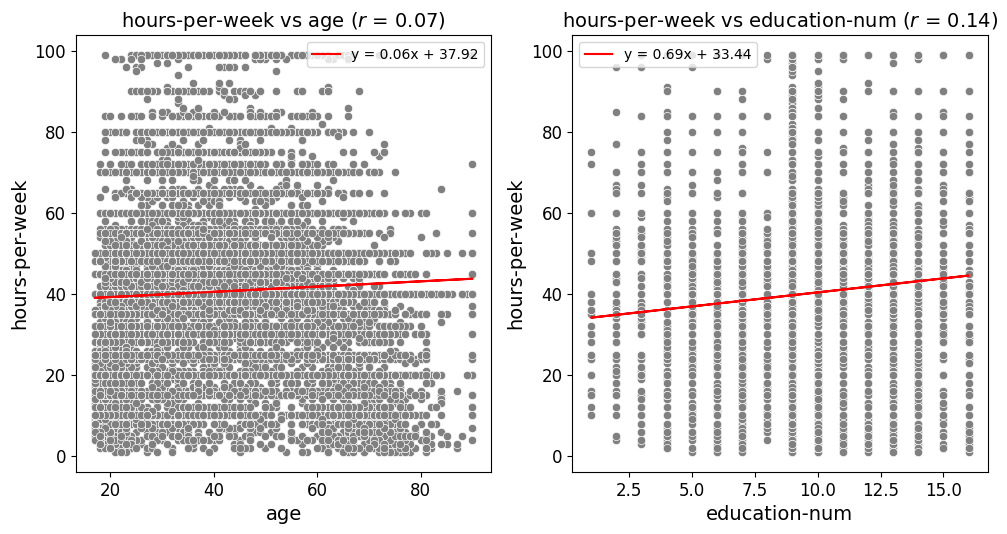
Creates and saves scatter plots or a grid of scatter plots for given x_vars and y_vars, with an optional best fit line and customizable point color, size, and markers.
import pandas as pd
import numpy as np
import random
from itertools import combinations
from IPython.display import display
import matplotlib.pyplot as plt
import matplotlib.ticker as mticker
import seaborn as sns
import textwrap
import os
import sys
import warnings

# Import the utility functions from EDA Toolkit
from eda_toolkit import (
    ensure_directory,
    add_ids,
    strip_trailing_period,
    parse_date_with_rule,
    data_types,
    dataframe_columns,
    summarize_all_combinations,
    save_dataframes_to_excel,
    contingency_table,
    highlight_columns,
    kde_distributions,
    stacked_crosstab_plot,
    plot_filtered_dataframes,
    box_violin_plot,
    scatter_fit_plot,
)Leonid Shpaner is a Data Scientist at UCLA Health. With over a decade experience in analytics and teaching, he has collaborated on a wide variety of projects within financial services, education, personal development, and healthcare. He serves as a course facilitator for Data Analytics and Applied Statistics at Cornell University and is a lecturer of Statistics in Python for the University of San Diego's M.S. Applied Artificial Intelligence program.

Oscar Gil is a Data Scientist at the University of California, Riverside, bringing over ten years of professional experience in the education data management industry. An effective data professional, he excels in Data Warehousing, Data Analytics, Data Wrangling, Machine Learning, SQL, Python, R, Data Automation, and Report Authoring. Oscar holds a Master of Science in Applied Data Science from the University of San Diego.
We welcome contributions! If you have suggestions or improvements, please submit an issue or pull request. Follow the standard GitHub flow for contributing.
This project is licensed under the MIT License. See the LICENSE file for details.
For more detailed documentation, refer to the docstrings within each function.
If you use eda_toolkit in your research or projects, please consider citing it.
@software{shpaner_2024_13162633,
  author       = {Shpaner, Leonid and
                  Gil, Oscar},
  title        = {EDA Toolkit},
  month        = aug,
  year         = 2024,
  publisher    = {Zenodo},
  version      = {0.0.8d},
  doi          = {10.5281/zenodo.13162633},
  url          = {https://doi.org/10.5281/zenodo.13162633}
}
-
Hunter, J. D. (2007). Matplotlib: A 2D Graphics Environment. Computing in Science & Engineering, 9(3), 90-95. https://doi.org/10.1109/MCSE.2007.55
-
Kohavi, R. (1996). Census Income. UCI Machine Learning Repository. https://doi.org/10.24432/C5GP7S.
-
Pace, R. Kelley, & Barry, R. (1997). Sparse Spatial Autoregressions. Statistics & Probability Letters, 33(3), 291-297. https://doi.org/10.1016/S0167-7152(96)00140-X.
-
Pedregosa, F., Varoquaux, G., Gramfort, A., Michel, V., Thirion, B., Grisel, O., Blondel, M., Prettenhofer, P., Weiss, R., Dubourg, V., Vanderplas, J., Passos, A., Cournapeau, D., Brucher, M., Perrot, M., & Duchesnay, E. (2011). Scikit-learn: Machine Learning in Python. Journal of Machine Learning Research, 12, 2825-2830. http://jmlr.org/papers/v12/pedregosa11a.html.
-
Waskom, M. (2021). Seaborn: Statistical Data Visualization. Journal of Open Source Software, 6(60), 3021. https://doi.org/10.21105/joss.03021.