To keep funding my research, I took a few more paid gigs which basically meant becoming a gun for hire. Cloud computing was colliding with the technology scene and there was lots of confusion about. Hence I had a constant stream of conferences — including some that actually paid — along with plenty of opportunity for piecemeal work. It was a wild west in computing with unfortunately some fairly shady practices and exploitation in the industry. I tried not to cause harm but I had an Achilles heel in simplicity.
One of the obstacles with mapping was that some people found it complex. This is not really unsurprising because you’re exposing people to a world that the majority are unfamiliar with. Few in business have practical experience with situational awareness or the use of maps. Many don’t understand why it might be important. It also takes time and effort to become comfortable with creating a map. A common response tends to be “can you create the map for us” based upon an idea that they will then apply their general like strategy to it. This always degenerates into “can you show us what moves we can make” to which they’ll apply their general like intellect to. In the end if becomes “which move should we make” and then general like nodding of their approval.
However, confusion over cloud computing had created an opportunity for a new way of thinking and hopefully learning. Alas piling on the complexity of mapping onto a bewildered person who has no connection to situational awareness can cause more confusion. Most people just wanted answers they could agree to such as how to solve their need of being in the cloud without rocking the boat too much. I’m guessing that’s why there has been an awful lot of questionable efforts in private cloud.
Hence I looked for ways to simplify mapping, to make it more palatable and more familiar. I started with spot painting. I’d take a business process diagram or a box and wire for an existing system, such as our Elvish self driving car in figure 36 (chapter 4) and then colour different parts according to whether they were more genesis or commodity. I’d produce something like figure 83.
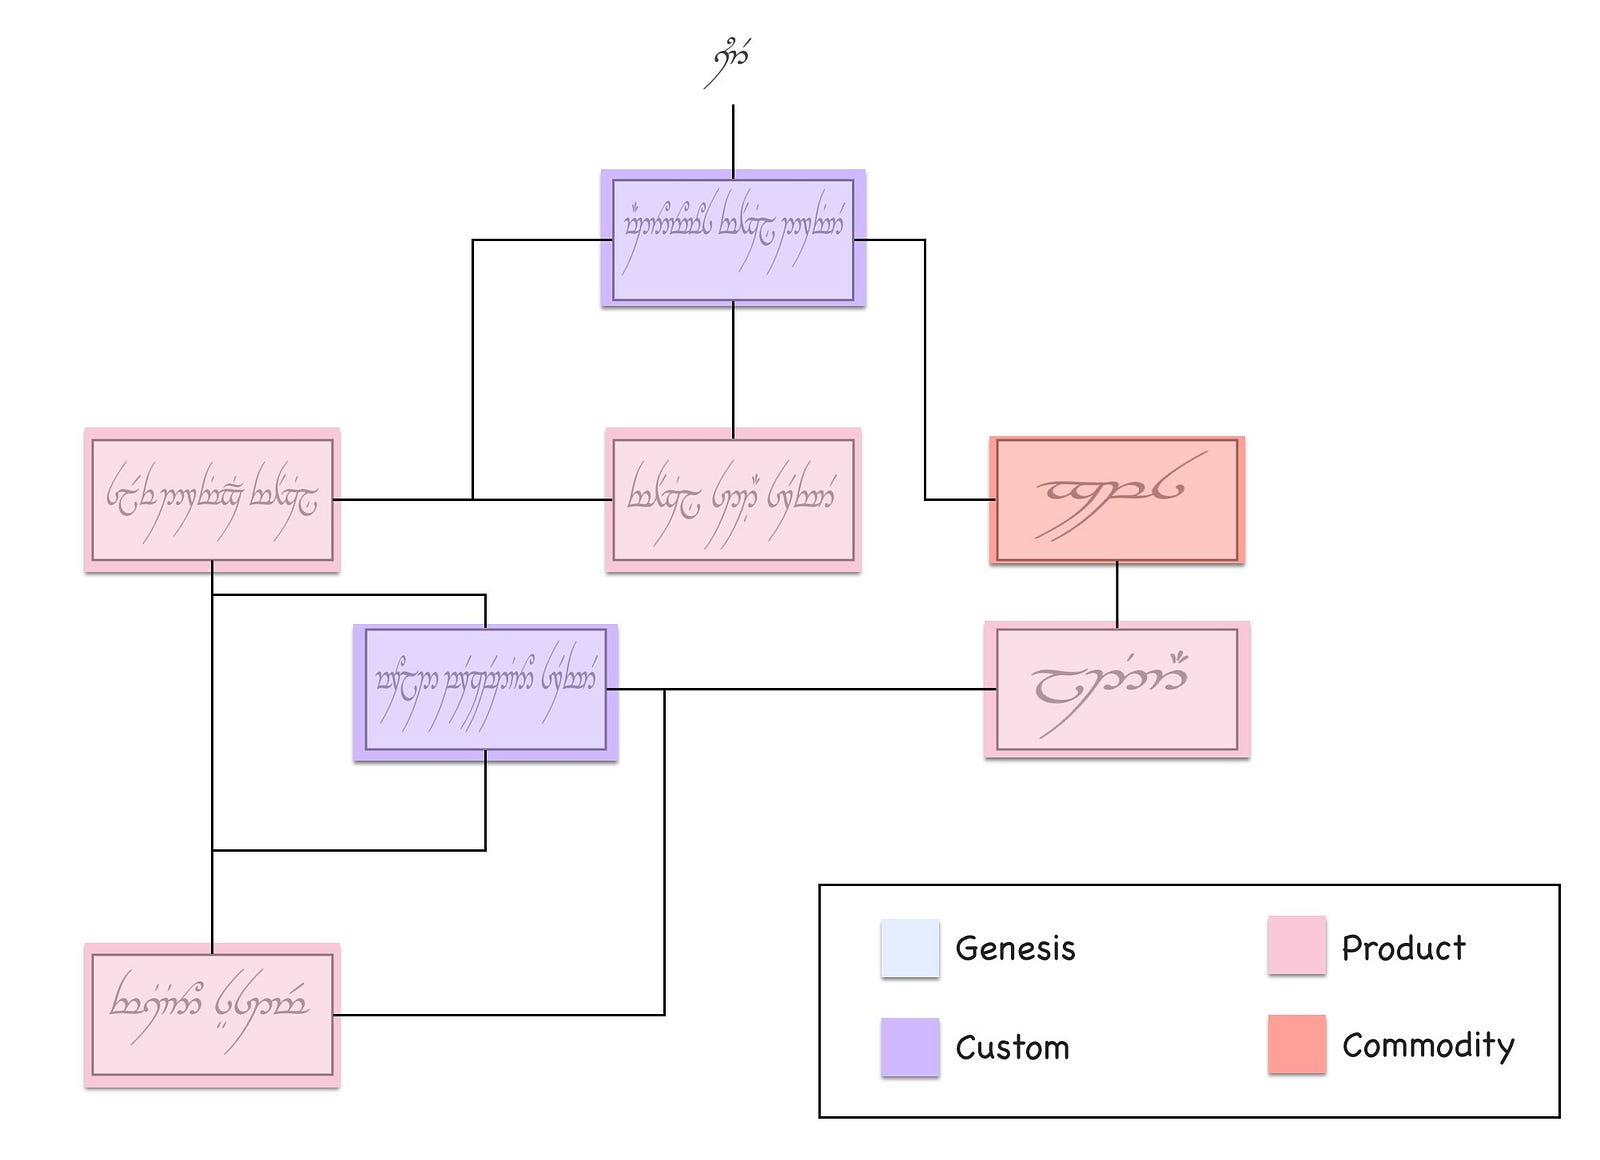
Such annotated diagrams along with being colourful were more familiar and less threatening to the people who had written the originals. They enabled me to fairly easily introduce the concepts of evolution into an organisation and hence we could have a discussion about what methods to use. But without position and movement then these diagrams were unhelpful for effective challenge and continuous learning of economic patterns or forms of gameplay. There was a trade-off between simplicity and usefulness.
Ashby’s law of requisite variety describes how the controlling mechanism of a system must be capable of representing what is being controlled. Organisations are both complicated and complex things. They are generally complicated because they have a large scope, contain many components that require specialisation and are difficult to grasp and manage. They are also complex because there are many emergent behaviours. For example, they have many components in the uncharted space for which there is uncertainty and you cannot predict this. The best you can do here is to feel your way. Whilst mapping provides you with a window onto this, you need to have a management capability able to cope with it.
There is unfortunately another solution to Ashby’s law. Instead of coping with a complicated environment that contains complexity, you make the choice to pretend that what is being managed is simple. In business, we like things such as 2x2 diagrams not because they represent reality but because they obscure it and hence are easy to understand. We trade-off our ability to continuously learn about the environment for an illusion of simplicity and easy management.
It’s important to make a distinction here. The act of taking something complicated (like a machine) and breaking it down into small but manageable components or using a mechanism to sense uncertain change in a complex environment is not the same as trying to manage such a system by pretending it’s a 2x2 matrix. As Einstein would say “Everything should be made as simple as possible, but no simpler”
Eventually, I was faced with a choice. Do I keep using these “spot” diagrams thereby making the concepts of evolution more accessible and just accept the flaws (and the cash) or do I take a slower path and try to push organisations towards a higher understanding of position and movement? If they struggled then I could compromise and do the heavy lifting for them by just providing a map and the results. However, I already knew this would make them dependent upon me which was the consultant path that I was trying to fight. My purpose was to free people from the shackles of consultants and not to chain them up even more. This compromise was out of the question. I had to take the slower path. I like to think that I stood my ground here but with very few companies mapping, bills mounting and clients taking an interest in the simplified concepts then it’s fair to say that I was starting to wobble.
My salvation was a piece of paid work that I’m particularly fond of. It concerned a question of efficiency versus effectiveness and to have any hope of explaining it then we first need to introduce three concepts— worth based development, pricing granularity and flow. After which we can connect them all together to examine this question. I’m going to have to jump around in history in order to do this but hopefully I can keep it all together.
In 2003, the company that I ran built and operated small sized systems for others. There were no big systems, these were more of the £100k — £2M scale covering a few million users. Our clients usually wanted to write a detailed specification of exactly what they needed to ensure we delivered. That doesn’t sound too bad but even at this small scale then some of the components in these projects would be in the uncharted space and hence no-one knew exactly what was wanted. Unfortunately, back then, I didn’t have the language to explain this. Hence we built and operated the systems and inevitably we had some tension over change control and arguments over what feature was in or out of a particular contract.
During one of these discussions, I pointed out to the client that we were sitting around a table arguing over a piece of paper but not one of us was talking about what the users needed. The contract wasn’t really the customer here; the client’s end users were. We needed to change this discussion and focus on the end user. I suggested that we should create a metric of value based upon the end user, something we could both work towards. The idea fell on deaf ears as the client was pre-occupied with the contract but at least the seed was planted. It wasn’t long after this that another project provided an opportunity to test this idea. The client gave me a specification and asked how much would it cost to build? I replied — “How does free sound?”
They were a bit shocked but then I added “However, we will have to be paid to operate the system. We need to determine a measure of value or worth and I’ll get paid on that”. There was a bit of um and ah but eventually we agreed to try out a method of worth based development.
In this case, the goal of the system was to provide leads for an expensive range of large format printers (LFPs). The client wanted more leads. Their potential end users wanted a way of finding out more on these printers along with a way of testing them. I would build something which would marry the two different set of needs. But rather than the client paying up front and taking all the risk, I would build it for free and take a fee on every new lead created.
We (as in the client and my company) were no longer focused on what was in or out of a contract but on a single task of creating more leads. We both had an incentive for this. I also had a new incentive for cost effectiveness because the more efficient I made system then the more profit I retained. We agreed and so I built and operated a system which enabled consumers to upload an image, test it on a large format printer and get delivery of their print plus information on the kit’s performance plus a sales call. The system soared.
In three months we had generated more leads than the client normally had in a year and this was accelerating. It was stunning. The client’s revenue was rocketing but so was my revenue as the system was based upon a metric of leads. The more success they had, the more success I had. It was a win-win situation or so I thought. Alas, this actually created two problems and one headache.
The problems were caused by the client being unprepared for this level of interest and internal budgeting systems that weren’t designed to cope with such a variable success. What has budgeting got to do with this? Well, for the client then success was more leads which translated into more revenue. This was good from a budgeting point of view. But the more success the client had then the more my fee increased as it was also based on leads. This was bad from a budgeting point of view. The system became so successful that it exceeded an internal budget figure the client had set for costs and this caused an internal conflict with demands to switch off the system until new budget was allocated (a very lengthy process). Switch off a revenue generating system because it’s doing better than expected and passed some arbitrary budget figure? This is what happens when an inflexible one size fits all approach of budgeting hits reality.
Before you go “this is daft”, actually it’s not. Over time companies tend to build up a body of work and processes — the corporate corpus — designed to stop past failure. It’s all done with reasonable intentions. The desire to spend money effectively and the desire to know resources are being well used. That mass of good intentions are often the cause of many problems when you try to change the system. That corpus can become a corpse, a zombie killing off innovation whenever it is found. I had attempted to change the system by introducing a worth based approach and I should have known that this would cause tensions with the corpus, in this case the budgeting system. I learned that lesson quickly.
I’ve used worth based approaches (often called “outcome”) many times over the last decade, in fact I prefer them. Whilst they tend to solve the issue of an excessive focus on contracts, they have invariably hit other roadblocks such as a client not being able to describe a metric of value or the purpose of the system or even conflict and politics within internal processes. You need to be aware of this and to mitigate against it.
Along with problems such as lack of preparation for the surge in demand or the corporate corpus there was also the headache that this worth based approach caused. This was my migraine. There was some financial risk associated with this project and some investment needed. I had to be concerned with not only the development but operations. This included lots of capital investment along with costs that weren’t either truly variable or ones that I could only guess at. To minimise the risk we shared common components with other projects but in a large heterogeneous application environment then this just complicates allocation of costs. How much would a user visiting our application cost us in terms of compute, power and data centre usage was an incredibly tough question.
In my risk models, I also had no clear way of determining operational costs as it scaled. I had to make lots of estimates on stepwise changes and how much compute resources would be used by an application that hadn’t been built. The financial model was more akin to art than any form of science. Some of that uncertainty ending up as “padding” in the metric e.g. the price per lead that I would charge. Fortunately other areas had better costs models. In the LFP example above then distribution systems and even printing were more variable (i.e. price per print or price per package) because we had experience of running an online photo and printing service. This brings me to the next topic of pricing granularity.
With a worth based approach then I have a strong incentive to: -
-
reduce the operational cost of the project because the cheaper it is then the more profit I make.
-
provide reliability because if the system went down, I wasn’t making any money.
-
ensure the system maximises the value metric. In the case of LFP then this metric was “generating leads”.
But I also had questions on where to invest. In the case of LFP, it was doing very well (this was prior to the budget shenanigans) and so I decided to look at investing an additional $100K. But where do I best put the money? Improving the site reliability? Reducing the operational cost of the application through better code? Maximising the number of users through marketing? Improving conversion of users to leads? Which choice brings me the better return? This is a particularly tough question to answer if you can’t effectively determine operational cost of an application beyond hand waving or if other data is also guessed at.
One of the huge benefits of Zimki (our platform as a service play in 2006) was not only its serverless nature and how you could simply write code through an online IDE but also its pricing granularity was down to the function. This was no accident as I had a genuine need to know this. Any application is nothing more than a high level function that calls other functions. If I developed a function in Zimki, whenever that function was called then I could see exactly how much it had cost me. I was charged on the network, storage and compute resources used by that function. This was quite a revelation. It changed behaviour significantly because suddenly in the sea of code that is my application, I could find individual functions that disproportionately cost me more.
As far as I know this pricing per function was unparalleled in the world of IT in 2006 and we didn’t see an equivalent pricing granularity until AWS Lambda was launched in 2014. Now, obviously I was also the provider of Zimki and behind the scenes there was a complex array of basket of goods concepts and all manner of financial instruments to be able to provide those cost figures. But this was abstracted from the developer. All they saw was a cost every time their function ran no matter how much it scaled. There was no capital investment and this turned the operational cost of an application into a manageable variable.
I’m now going to combine the ideas of worth based (outcome) development and pricing granularity to introduce an idea known as flow. To do this, we’re going to revisit the LFP project but this time with a map and the knowledge of what a utility platform can bring. Back when we were actually working on the LFP project, I hadn’t developed the mapping concept fully and Zimki wasn’t released. Hence this is a post event analysis and more of a what could have happened rather than what did.
So, let us go back to 2008. We know how to map (we knew this in 2005). Let us imagine that Zimki (launched in 2005) had survived or some other equivalent platform as a service has arisen. Let us now imagine a scenario where the client has turned up with the LFP project and is willing to build this using worth based development (as happened in 2003).
In figure 84, I’ve created a map of the worth based LFP project. I won’t mark-up points on this map, hopefully you’ve enough experience now to start reading them.
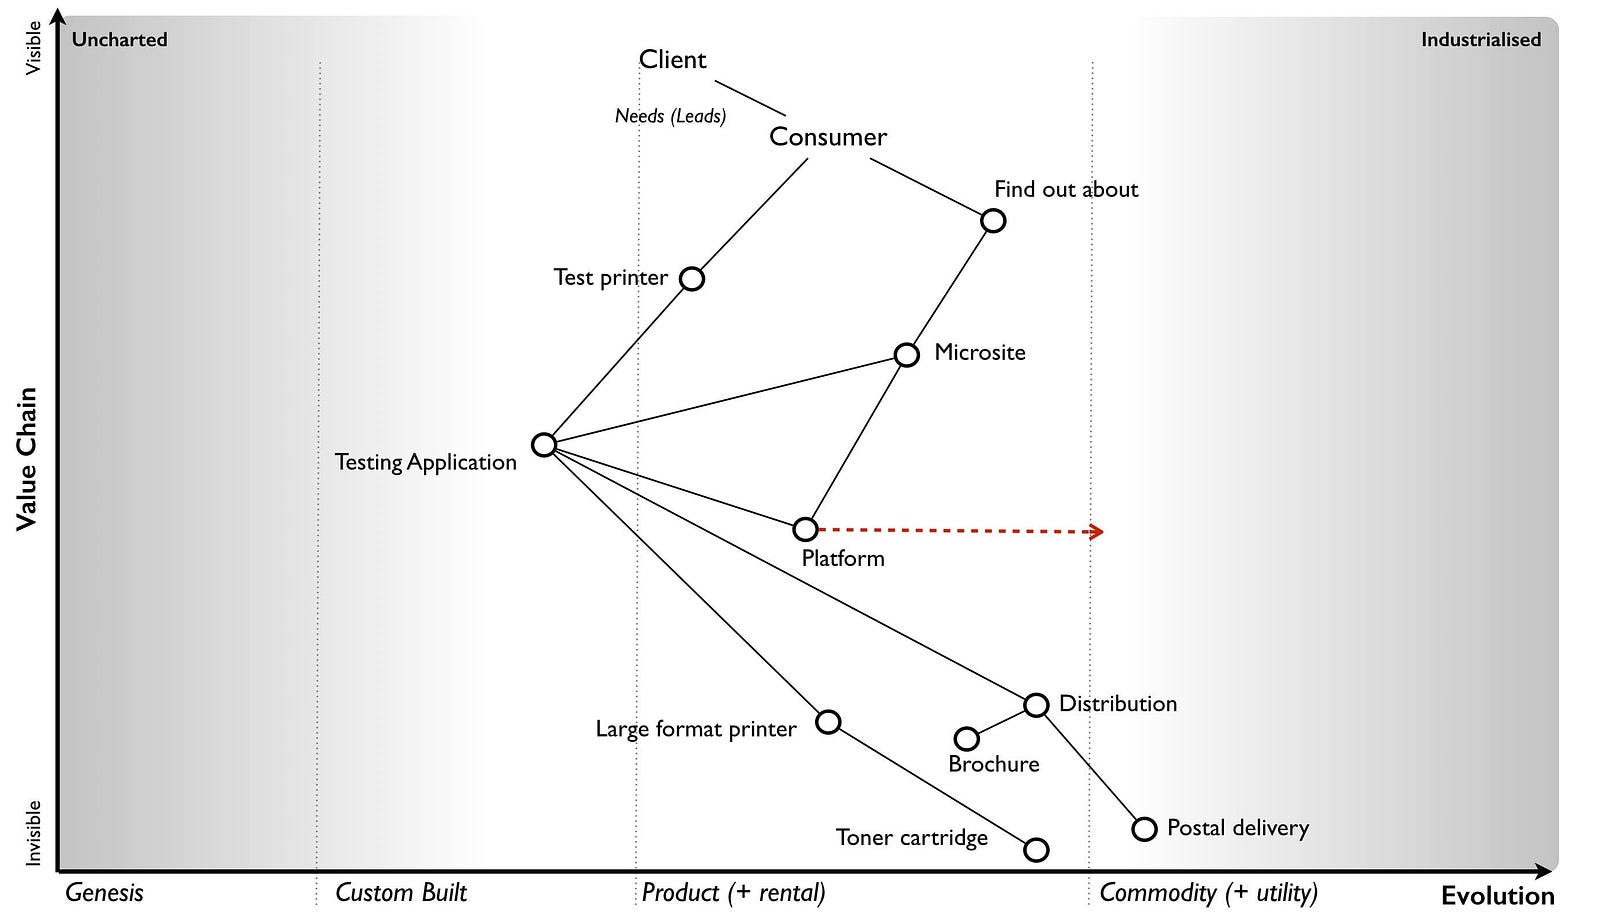
The map begins with our client who has a need for more leads and ultimately consumers buying their product. The conversion from lead to actually purchasing a printer is beyond the scope of this project as that was within the client’s sales organisation. We’re focused solely on generating leads. The other type of user in this map is the consumer who hopefully will buy one of these expensive printers. They have different needs, they want to find out about the right sort of printer for their commercial operations and to test it before buying something they will use. In this project, we’re aiming to provide an online mechanism for the consumer to find out about the printer (a microsite) along with a method to test it (the testing application).
The test is a high resolution image that the user uploads and which is then printed out using the printer of their choice. Their poster (this is large format) would then be distributed to the user along with a standard graphical poster (showing the full capabilities), relevant marketing brochures and a sales call arranged. The platform space — which was the source of my original headaches due to my inability to provide a variable operational cost for application use — is evolving towards more of a utility service.
So, let us assume we decide to use a utility platform. I’m now going to add some financial indicators onto this map. See figure 85.
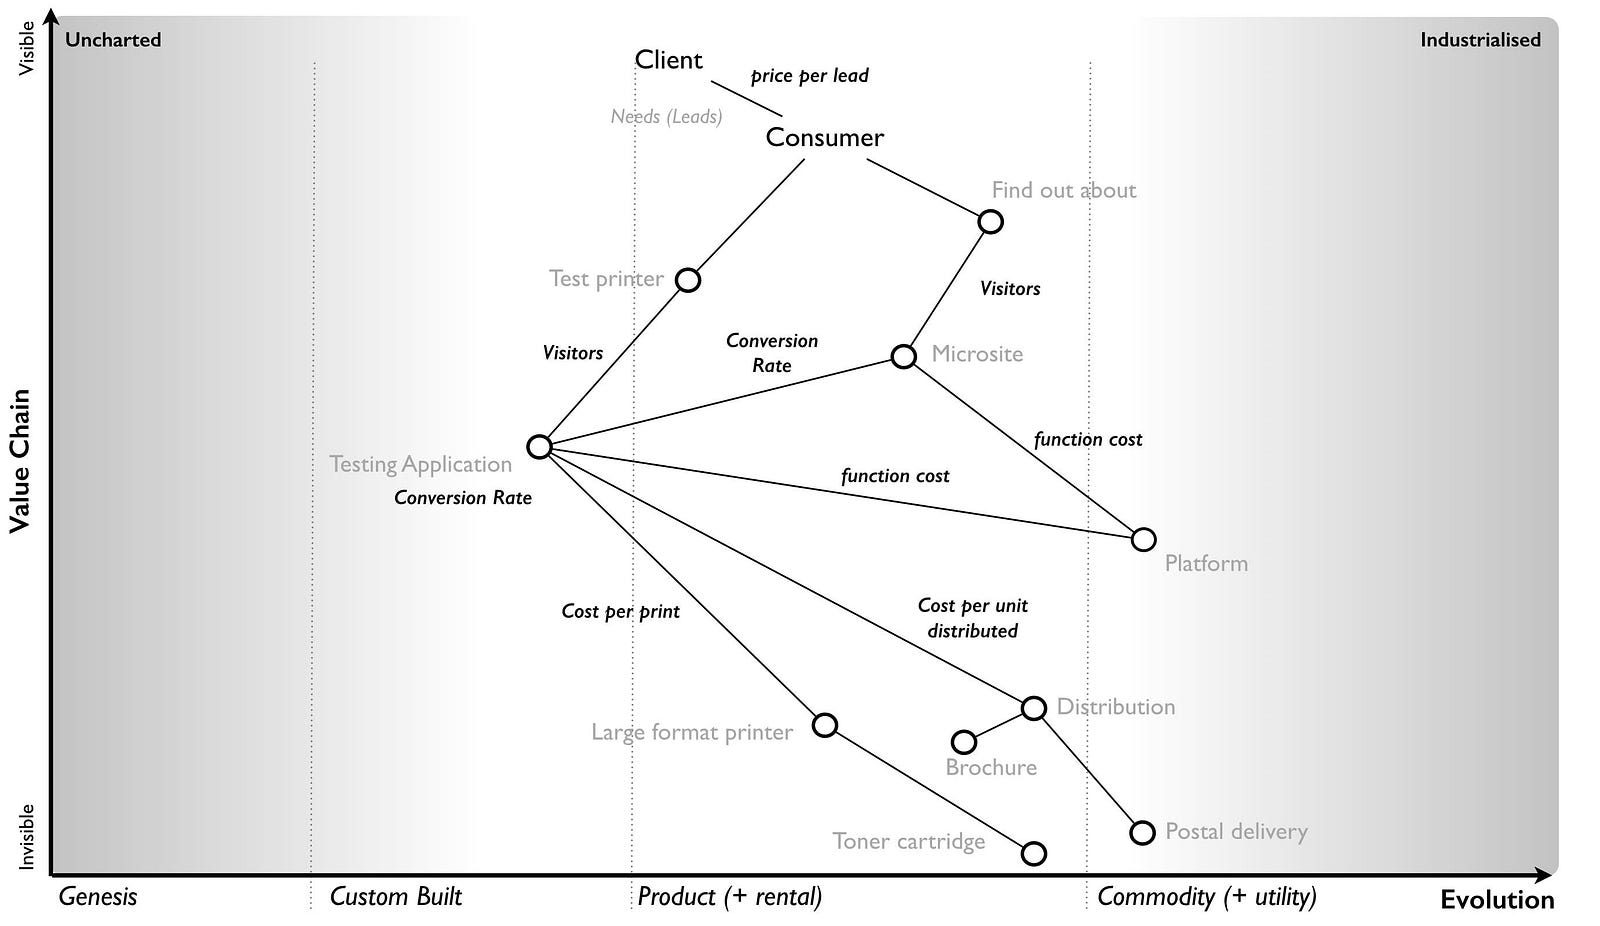
From the map, we hope to have users visit our microsite which would extol the benefits of owning a large format printer. This hopefully persuades some of these visitors to go and test it out. The act of turning a visitor into an actual lead requires the user to test a printer. So we have multiple conversion rates e.g. from microsite to testing application and from visitor to lead. At the start these will be unknown but we can guess.
Normally, operating a microsite requires all those hard to calculate costs but in a utility platform world, your application is simply a function running on the platform and I’m charged for use. The operational cost of my microsite is basically the number of visitors x the average cost of the microsite function. Remember, an application consists of many functions and users can navigate around it which means some “wandering” users turn out to be more expensive than others. But we can cope with that by taking an average for our microsite.
The same will apply to my “test the printer” (testing) application but in this case the users will include converted visitors from the microsite along with those who directly visit. Every use of the testing application (a function) will incur a cost. But as with the microsite, this is a variable. Of course, the actual functional cost of the testing application could be wildly different from the microsite depending upon what the applications did and how well the code was written but at least we would have a granular price for every call. Finally, every visitor who tests a printer will create a distribution and printing cost for me but also revenue as they have become a lead.
This isn’t the only path by which someone can print out a poster. The visitor might not come from the microsite but instead go directly to the testing application through word of mouth or if we expose the testing application as an API. There are a number of potential flows through the map.
When you look at any map, there can be many forms of flow within it whether financial or otherwise. It could be flows of revenue or flows of risk. For example, if the utility platform dies due to some catastrophic event then it’ll impact my microsite and my testing application which will impact the consumer needs and stop any lead generation. This would incur a financial penalty for me in terms of lost revenue. Whereas, if I run out of brochures then this impacts distribution and I have a choice on whether to send out the prints now or delay until the brochures are available. In figure 86, I’ve given an example of a flow within a map from potential consumer through their need to microsite to testing application to distribution.
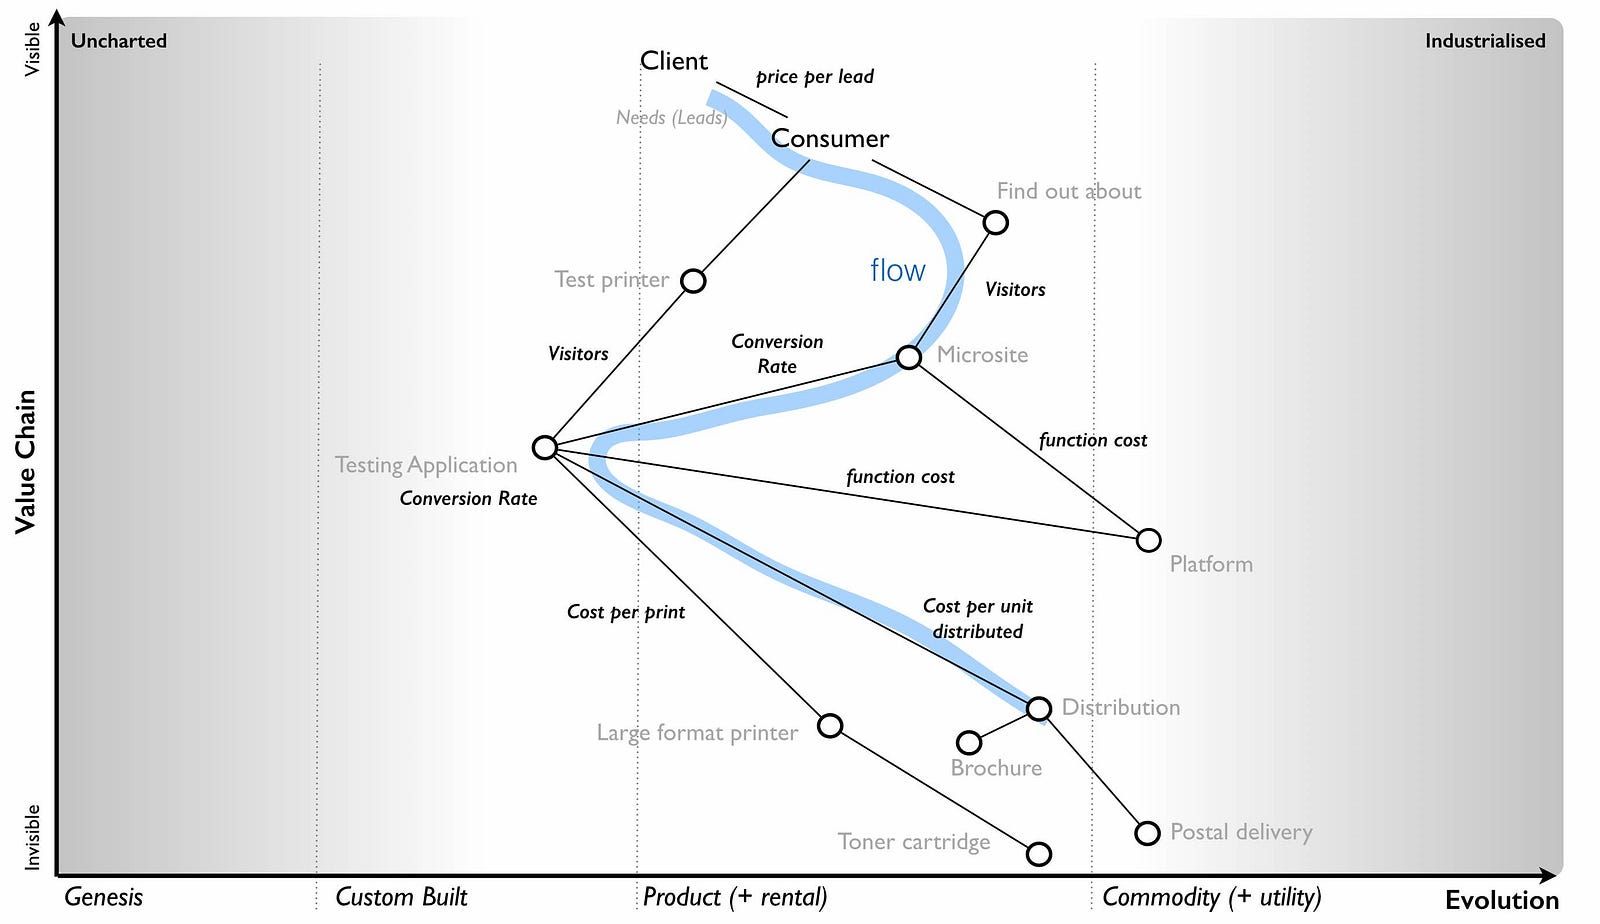
It’s important to note that the interfaces between components in a map represent these flows of capital whether physical, financial, information, knowledge, risk, time or social. It could be anything which we trade. Things are rarely free. Whenever you use a service then you’re trading something whether it’s information or social capital (e.g. loyalty to a scheme) or even just your time (e.g. to create new entries, to edit the content).
By using the concept of flow, it is relatively simple to build a financial model for the system. In figure 87, I’ve created the skeleton of such a model for the map above.
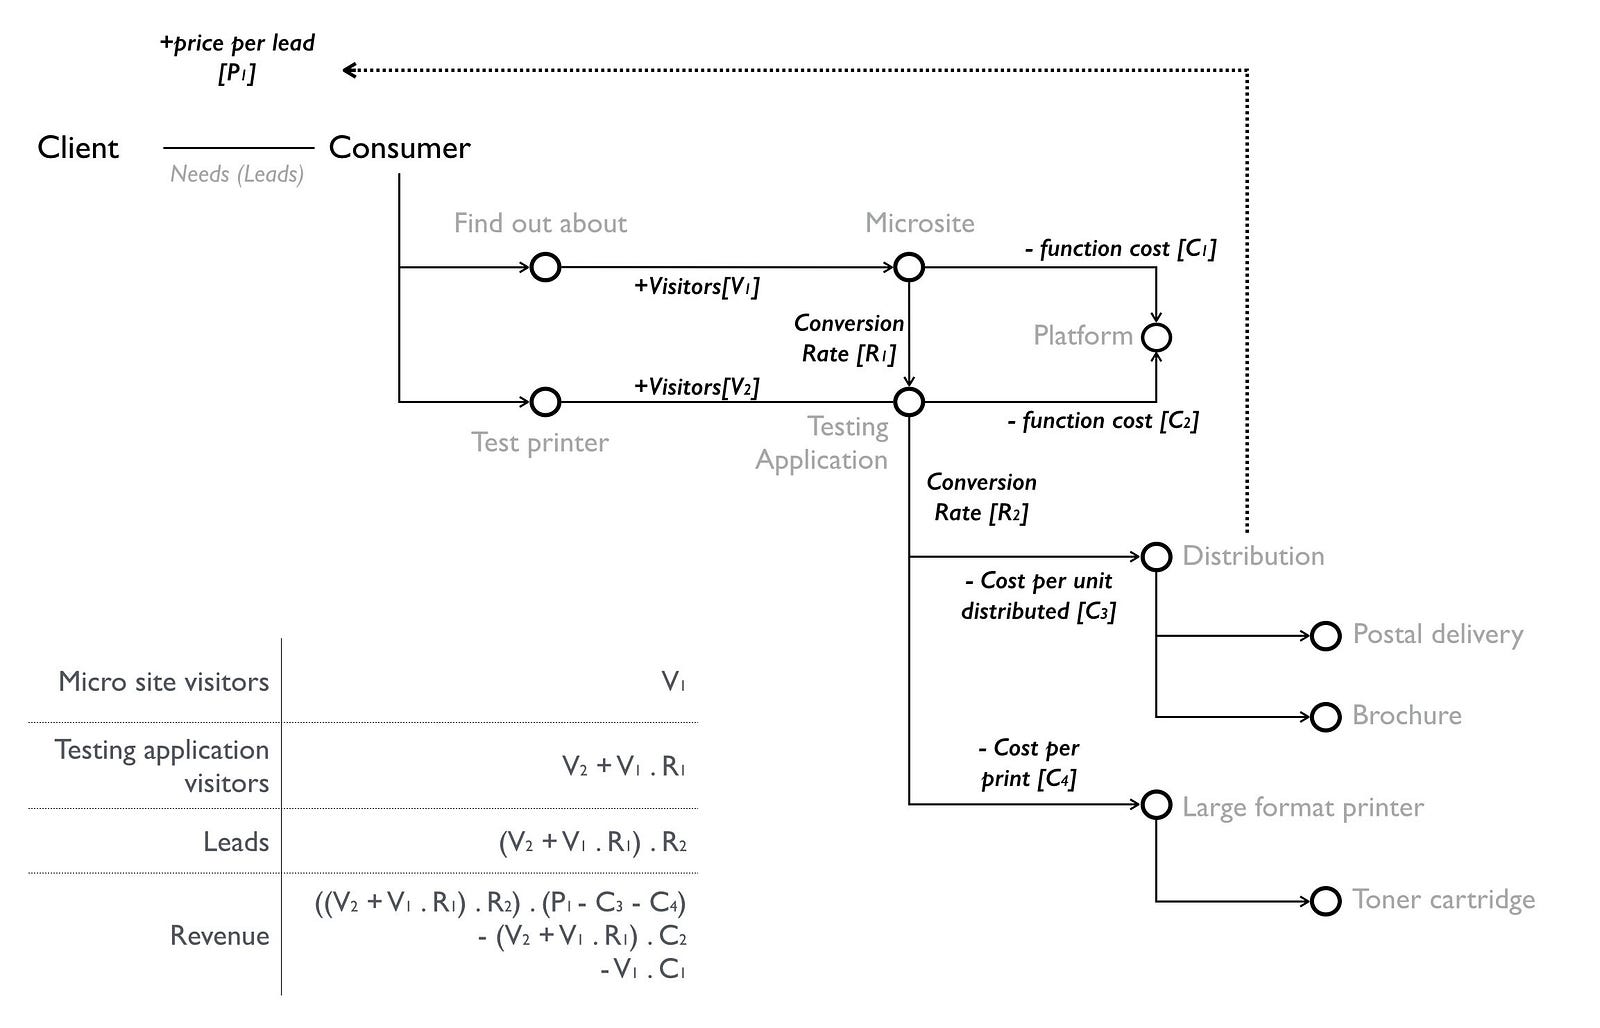
This is like manna from heaven for someone trying to build a business. Certainly I have the investment in developing the code but with the application being a variable operational cost then I can make a money printing machine which grows with users. It also changes my focus on investment — do I want to invest in increasing marketing for more users, or the conversion rate, or maybe the testing application is so badly written (or a function within it) that investing in coding improvement will bring me better returns? Suddenly, the whole way I build a business and invest is changed.
Now back to when we originally built LFP in 2003. There wasn’t a utility platform, I didn’t have maps and I didn’t have the concept of flow. Instead myself and my CFO had a mass of spreadsheets trying to calculate what the above did and cope with all the stepwise investments and capital costs needed. What was a nightmare in 2003 is child’s play in 2016.
Whenever you’re building something novel, then the game is to use operational expense over capital as much as possible in order to reduce risk either due to the system not being used or growing rapidly. You want to tie the cost as close to the path of revenue generation especially within any worth based system when you’re gambling on an uncertain outcome. However, there will always be some investment e.g. writing the application, marketing the microsite. This sort of modelling can help you identify which options improve the equation and hence where you should invest for the future.
Having introduced the concepts of worth based development, pricing granularity and flow, let us now get back to our main story.
So there I was in 2008 with an understanding of the importance of maps and of the flow of capital within them. This helped me explain a question of efficiency versus effectiveness in one of my client’s projects. I was quite proud of this. There is unfortunately a problem.
Hopefully, you’re discovering that maps can be a quite useful strategic tool. The information they contain can be very sensitive. I’m certainly not going to break the trust of a client by exposing their dirty laundry. This is why many of the maps that I use in this book are slightly distorted and don’t identify the original owner unless I was the one running the show. I don’t mind you knowing all the mistakes and failings that I’ve made but not everyone is like that. If you’re uncomfortable with this and you need the reassurance of being told that “big company X did Y” then you’ll need to find someone else to help you.
To overcome this issue of confidentiality, the next section covers a hypothetical that blends a story related to a modern company to help tell a past story which I’ve set into a technology context. Yes, maps are part of story telling but as J.R.R Tolkien said on writing the Lord of the Rings, “I wisely started with a map.”
Our story begins, as many do, with a challenge and unfortunately no maps. The company was expanding and needing to increase its compute resources. It had created a process flow diagram for this (figure 88) which involved a request for more compute to the actions needed to meet that demand.
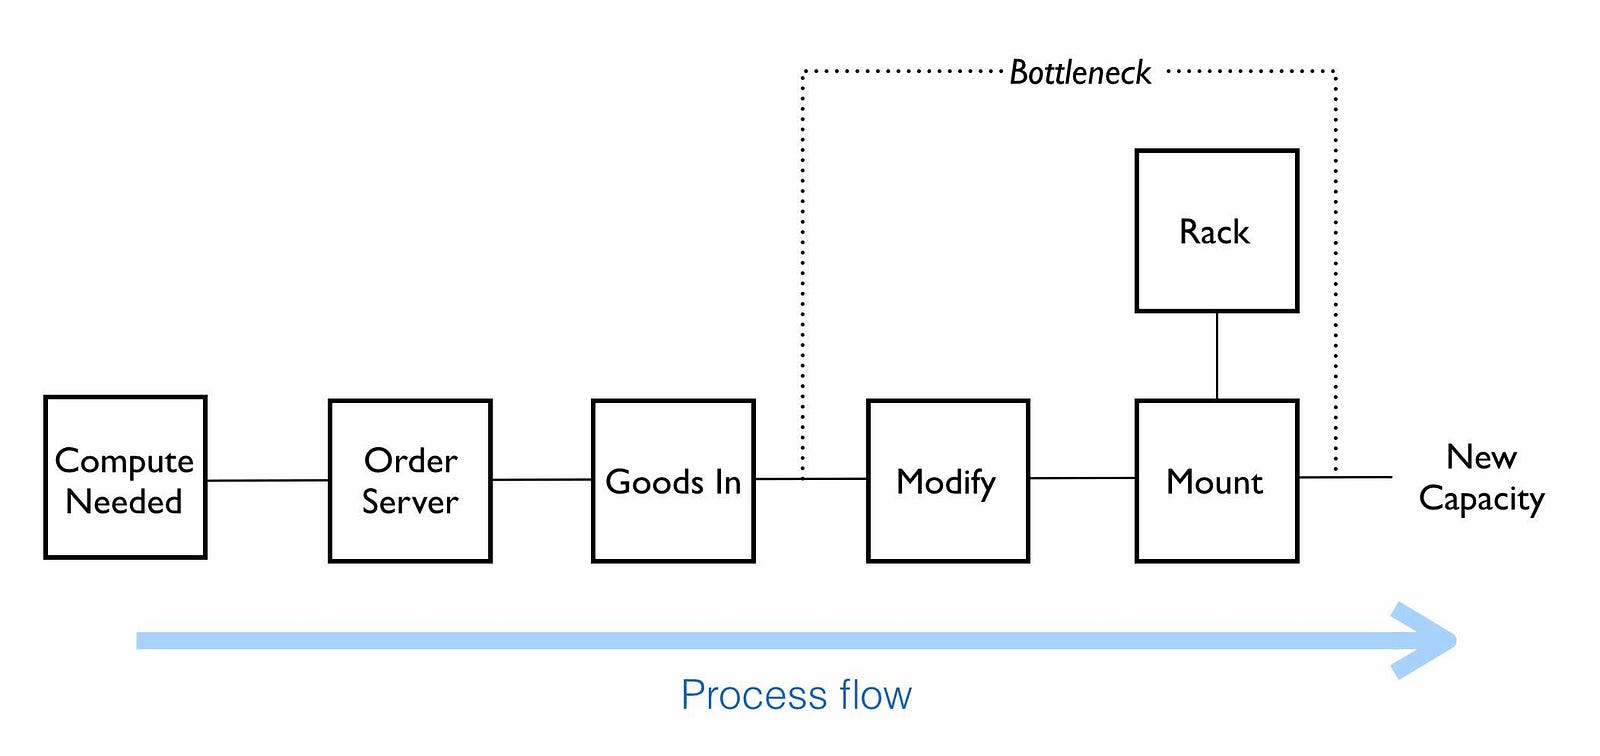
The process however had a bottleneck. Once servers were delivered at “goods in” they needed to be modified before being racked. This was time consuming and sometimes prone to failure. They were focused on improving the efficiency of the process flow as it was important for their future revenue generation. A proposal was on the table to invest in robotics to automate the process of modifying the servers. Whilst the proposal was expensive, the benefits were considerable especially given the significant future revenue that was at risk. A strongly positive ROI had been calculated.
I want you to consider the above for a moment and decide whether a proposal to invest in improving the efficiency of an inefficient process makes sense particularly when the benefits of the proposal vastly outweigh the costs and your future revenue stream is at risk?
I had met the company, talked about the concept of evolution and it would be fair to say they had no interest in mapping. I had mentioned the “spot” diagram and we agreed to take a look at the proposal through this lens. I’ve taken those first same steps (see figure 89) and “spotted” the process. Whilst the ordering and goods in process were quite industrialised, the modify part of the process was very custom.
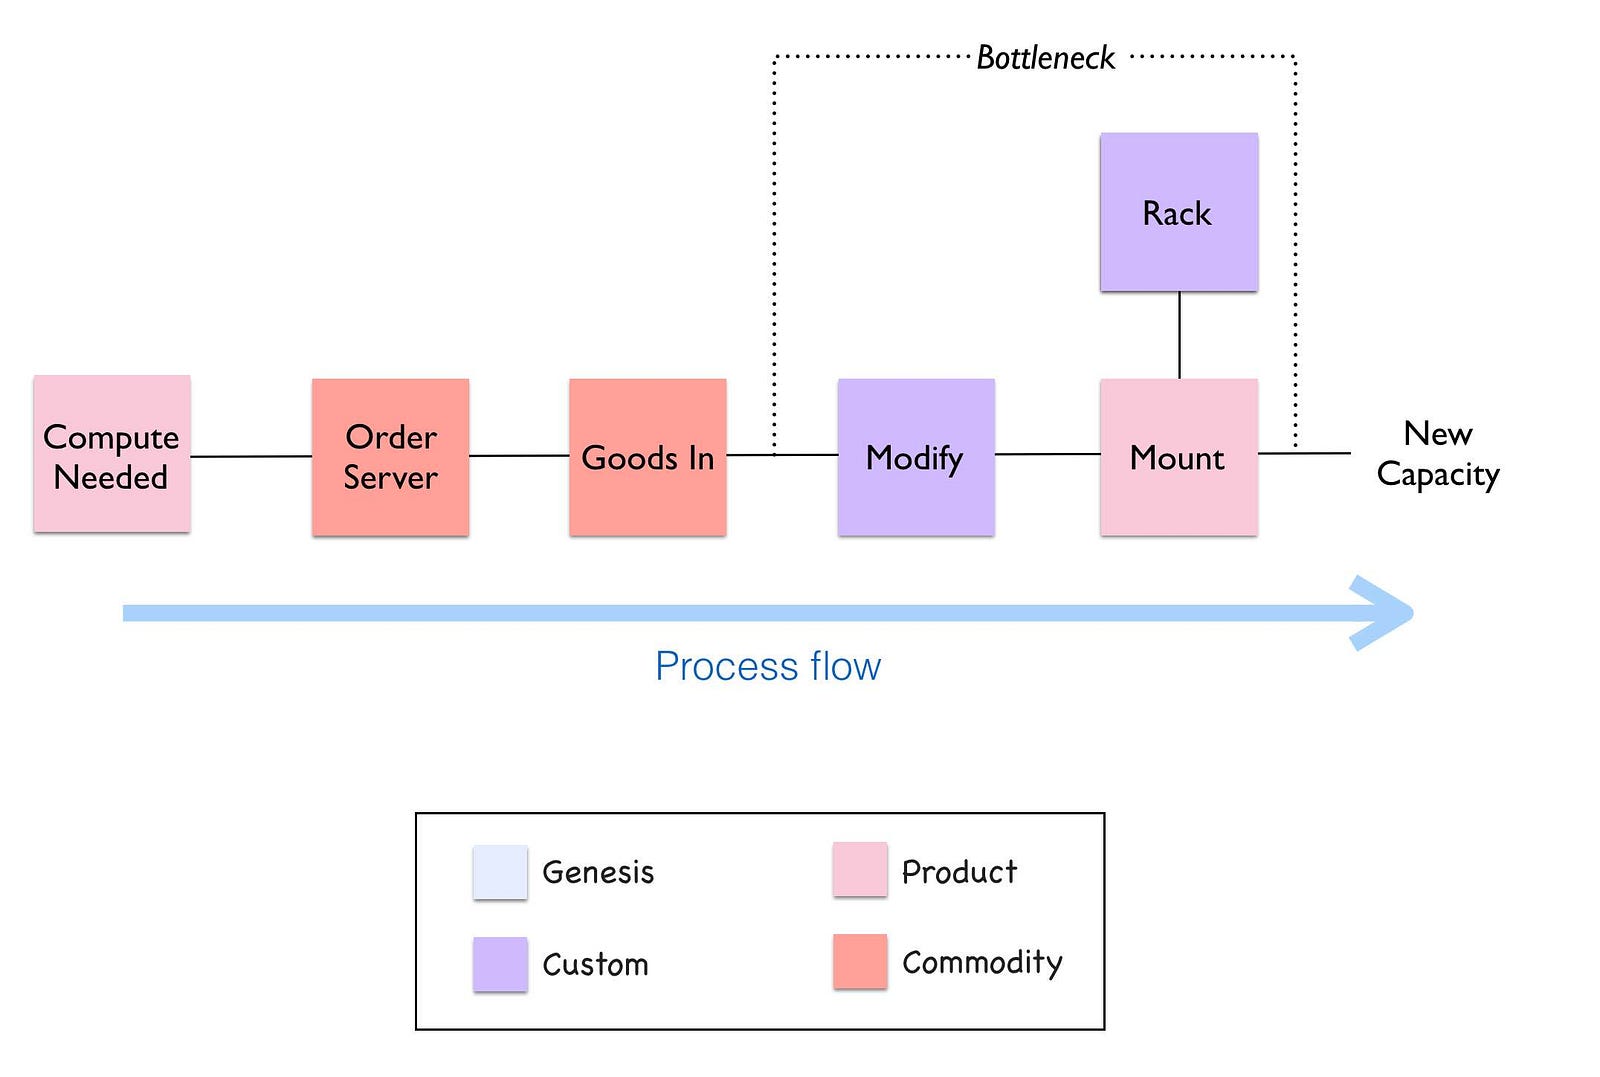
It’s important to take a break for a minute here and have a good look at the diagram above. Try and see if you notice anything interesting or odd before continuing with this story.
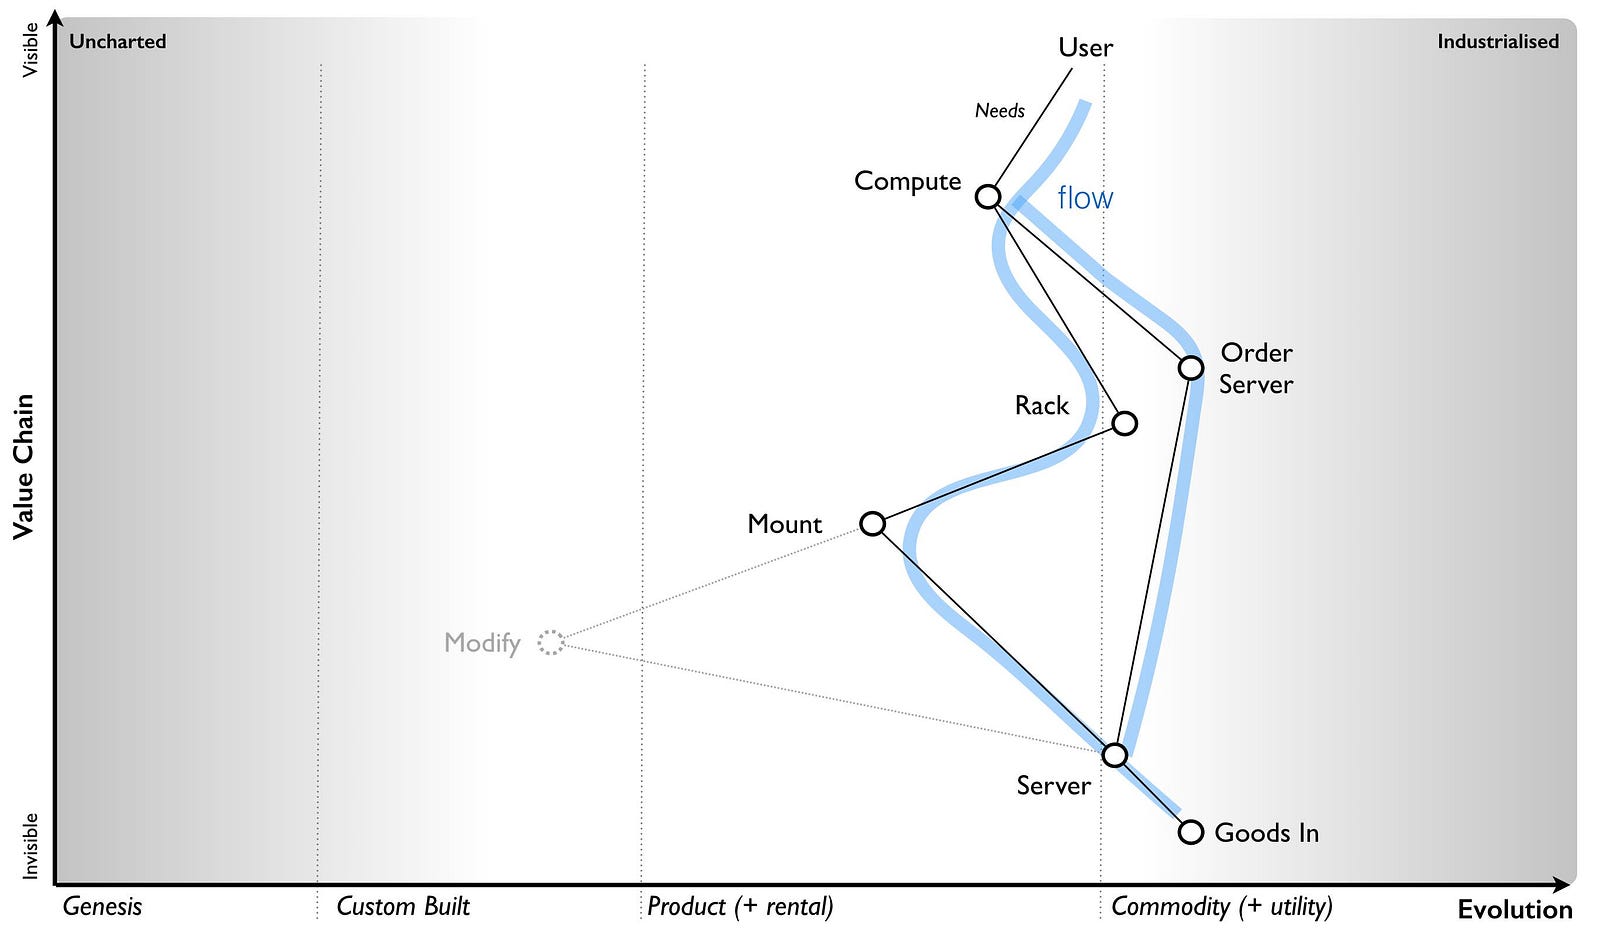
I’m now going to turn the diagram above into a map and hopefully the problem will become clearer. Let us start from the user need of more compute. This actually has two needs, the ordering of a server and the racking of the server once it has been delivered. Apparently mounting the equipment (i.e. racking, adding power and cabling) needs modifications to be made to the server hence the companies interest in automation with robotics. Both of these chains are connected at the point of the “server” and “goods in”. I’ve drawn this in figure 90 with both flows.
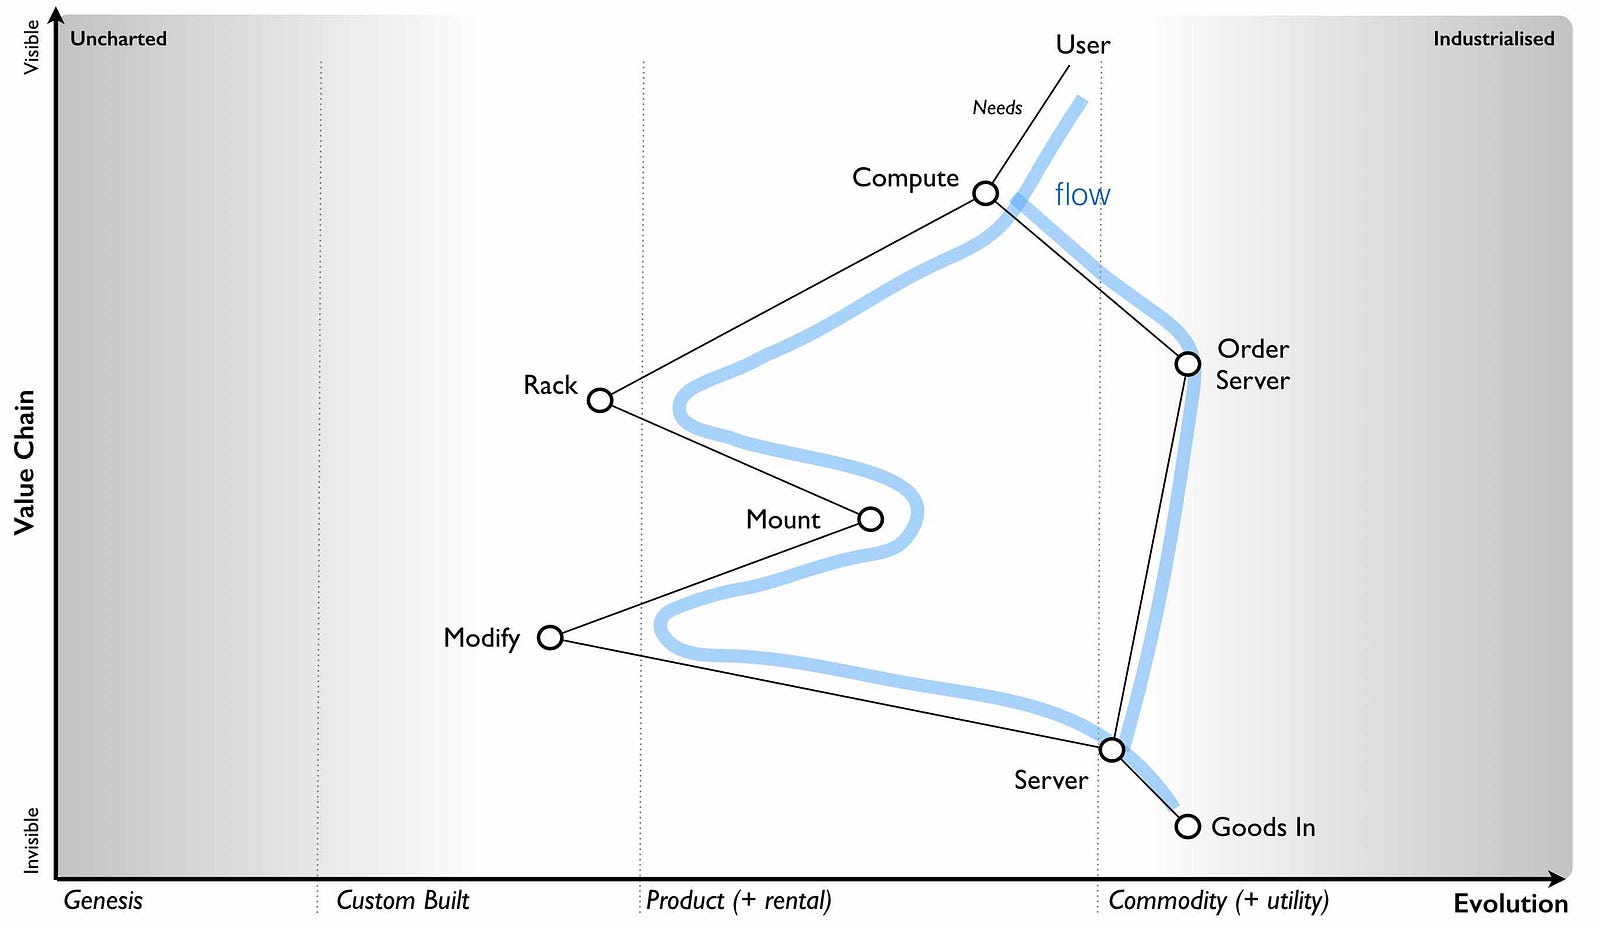
Take another break for a minute here and have a good look at the diagram above. Try and see if you notice anything interesting or odd this time before continuing with this story.
What is worth noting is the racks were considered custom. On investigation, the company had always used custom built racks and it even had a friendly company that made them for it. This was just part of its corporate corpus, a ghost from a long gone past that still haunted the place. If you asked the company why they were using custom built racks they’d tell you that this is what they’ve always done, it was how they worked and the racks were designed for them. They’d would also tell you that racks was irrelevant to the project at hand which was all about automation.
However, dig a little bit more and we come to reason why the servers needed modification. It turns out that standard servers are designed to fit standard racks. They didn’t fit the custom built racks that the company had so lovingly built. Hence additional plates needed to be added, holes drilled into the servers — this was the modification that was required. Let us be clear, on the table was a proposal to invest in robotics in order to customise standard servers in order that they fit into custom built racks which the company was buying. Does the proposal still make sense? Is it a good investment? Are there alternatives? Do I hear you shout “use standard racks?”
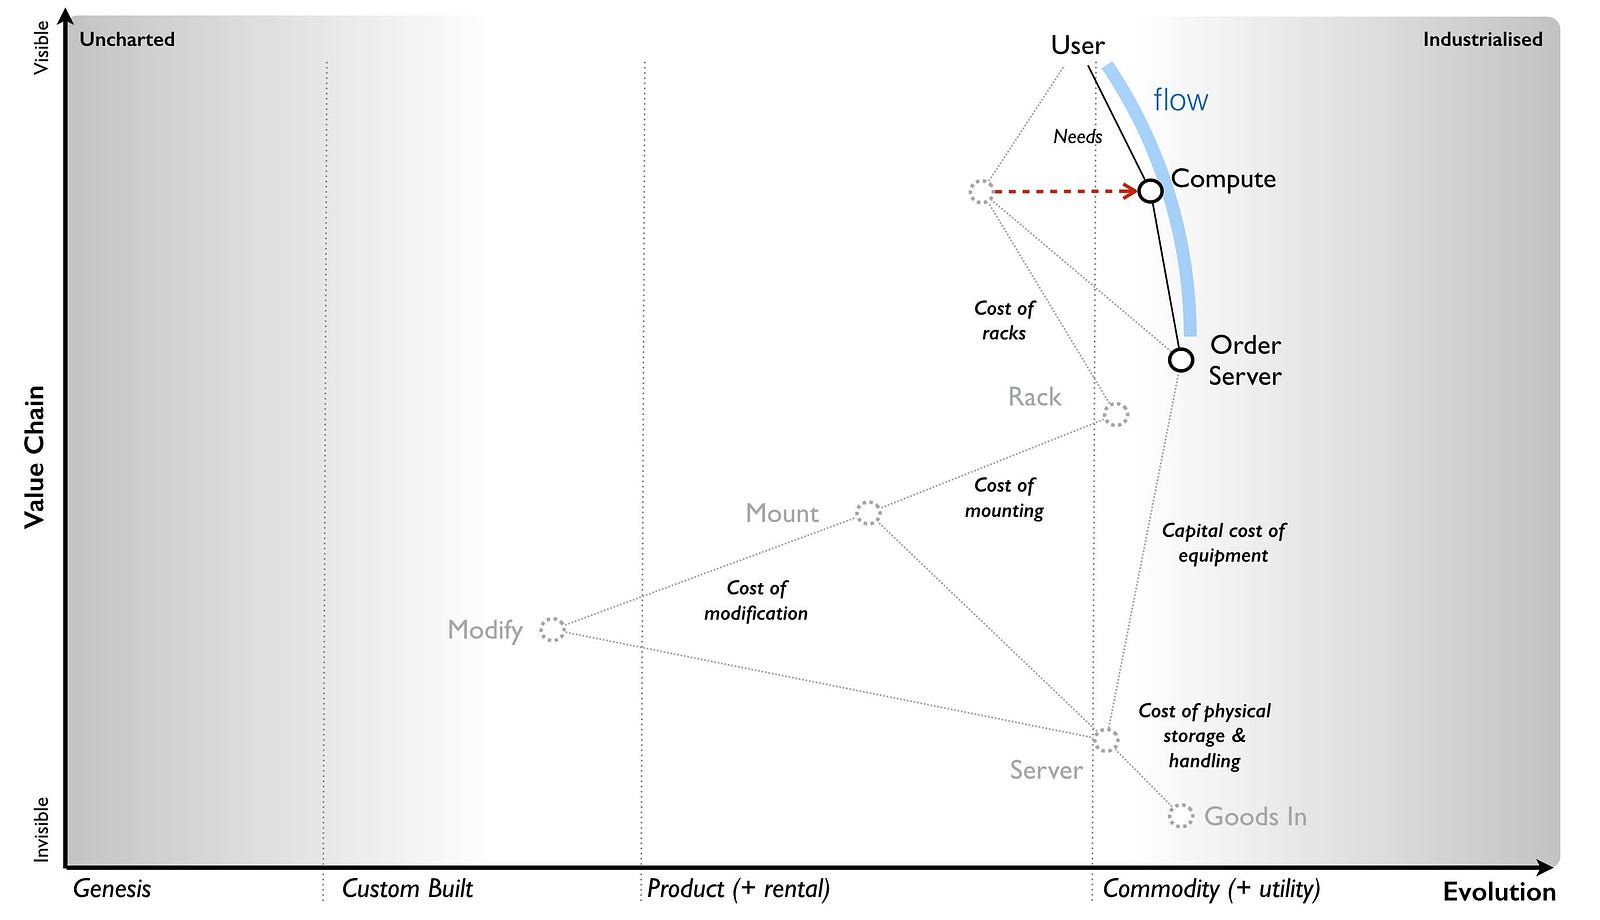
Now the question is whether we should just use standard racks? This obviously moves racks towards the commodity (which is where they should be) and the modification part disappears though we still have mounting, cabling and power. It seems a lot better though (see figure 91).
However, you still have a problem which is the legacy estate. Are you going to migrate all the racks? What about our sunk costs? How are we going to maintain our existing systems? There will be a long list of reasons to counter the proposed change. Before you go “this is daft, we should just change” remember the budget example, the corporate corpus and don’t expect to change a system without some resistance.
In this case, despite resistance, we should go a step further. Computing was becoming a commodity provided by utility services. We can simplify this whole flow by just adopting utility services for any new work. We don’t need to think about robotic investment or even converting to using standard racks (itself a cost which might be prohibitive). This entire chunk of the value chain should disappear over time along with any additional costs it might be hiding (see figure 92).
In this story, we started with a proposal of investment into robotics based upon improving the efficiency of an existing process. It sounded reasonable on the surface but if they had taken that route then they would have invested more in maintaining a highly ineffective process. In all likelihood, it would have exacerbated the problem later because the corporate corpus would have expanded to include this robotic investment. If some future person had said “we should get rid of these custom racks” then the response would be “but we’ve always done this and we’ve invested millions in robotics”.
I used the “spotted” process flow to get us part of the way i.e. identifying the custom built rack as the problem. However to really understand this space then we needed a map and the flows within it. The “efficient” thing to do might be investing in robotics but the “effective” thing to do was to get rid of this entire part of the value chain. It’s a bit like the utility platform question. I can either invest in making my infrastructure and platform components more efficient by automation or I could just plan to get rid of that entire part of the value chain by using a utility platform. Often the “efficient” thing to do is not the “effective” thing.
However, a word to the wise. This was 2008 and the idea of getting rid of custom built racks and adopting a move towards using infrastructure from a utility provider was not welcomed. It’s easy in 2016 to say “this is obvious” but that’s because most people now have the benefit of hindsight. In 2008, such ideas were seen as radical and even dangerous. The changes necessary were far from welcomed within the organisation and it was fought every step of the way from executives to the ground floor. Without the courage and conviction of the CEO and a few “rebels”, the company would have happily spent millions on robotics and would be still building custom racks today.
From experience, you should be careful with both your use of simplification when viewing a landscape and the inertia that exists. You should be very careful of process improvements focused solely on efficiency. You should be extremely careful when dealing with the corporate corpus.
The company in question was a manufacturing company, the real scenario had nothing to do with computing and yes, they were about to spend many millions making a highly ineffective process more efficient. They didn’t, they are alive and doing well. I also kept the wolves at bay. That’s what I call a “win-win” except obviously for the vendors who lost out.
In the last few chapters, we’ve been sneaking around the strategy cycle covering mainly purpose and then landscape. You should be familiar enough with the strategy cycle that I don’t need to repeat it. We will keep on looping around this, sometimes diving into interconnections as we go. Anyway, this will be the last time that I’ll mention that. We should recap on some of the ideas from this chapter.
-
Be careful of simplicity. There’s a balancing act here caused by Ashby’s law. Be aware that you’re often trading your ability to learn for easier management. In some cases, you can simplify so far that it becomes harmful e.g. one size fits all and group wide KPIs. Often people talk about the KISS principle (Keep it simple, stupid) just remember that by keeping it too simple then you can make some pretty daft choices.
-
The map contains flows of capital which are represented by the interfaces. There are usually multiple flows in a single map. Such capital can be physical, financial, information, knowledge, risk, time or social. It could be anything which we trade and is traded between the components.
-
Maps are a means of storytelling. Despite my dour attitude to storytelling (especially the hand waving kind of verbiage often found in strategy), maps are a form of visual storytelling.
-
Focus on the outcome, not the contract. Worth (outcome) based tools can be useful here but be warned, they can also expose flaws in the understanding of value and become stymied by the corporate corpus e.g. a budgeting processes and its inability to cope with variable charging.
-
Use appropriate tools. When using maps, if I’m looking at financial flows then I’ll often dive into financial modelling when considering multiple investment paths e.g. focus on increasing visitors through marketing or the conversion rate from a microsite. Equally, if I’ve identified multiple “wheres” that I can attack, then I’ll often dive into business model canvas to compare them. Don’t be afraid to use multiple tools. Maps are simply a guide and learning tool.
-
Optimise flow. Often when you examine flows then you’ll find bottlenecks, inefficiencies and profitless flows. There will be things that you’re doing that you just don’t need to.
-
Be very careful to consider not only efficiency but effectiveness. Try to avoid investing in making an ineffective process more efficient when you need to be questioning why you’re doing something and uncovering hidden costs. Also, don’t assume that an “obvious” change will be welcomed. Beware the corporate corpus.
-
When it comes to managing flow then granularity is your friend. Be prepared though, most companies don’t have anywhere near the level of granularity that you’ll need and you may even encounter politics when trying to find out. Think small, as in know the details.
-
Any map can contain multiple different users and often the needs of those users can be in conflict though you should try to bring them all together.
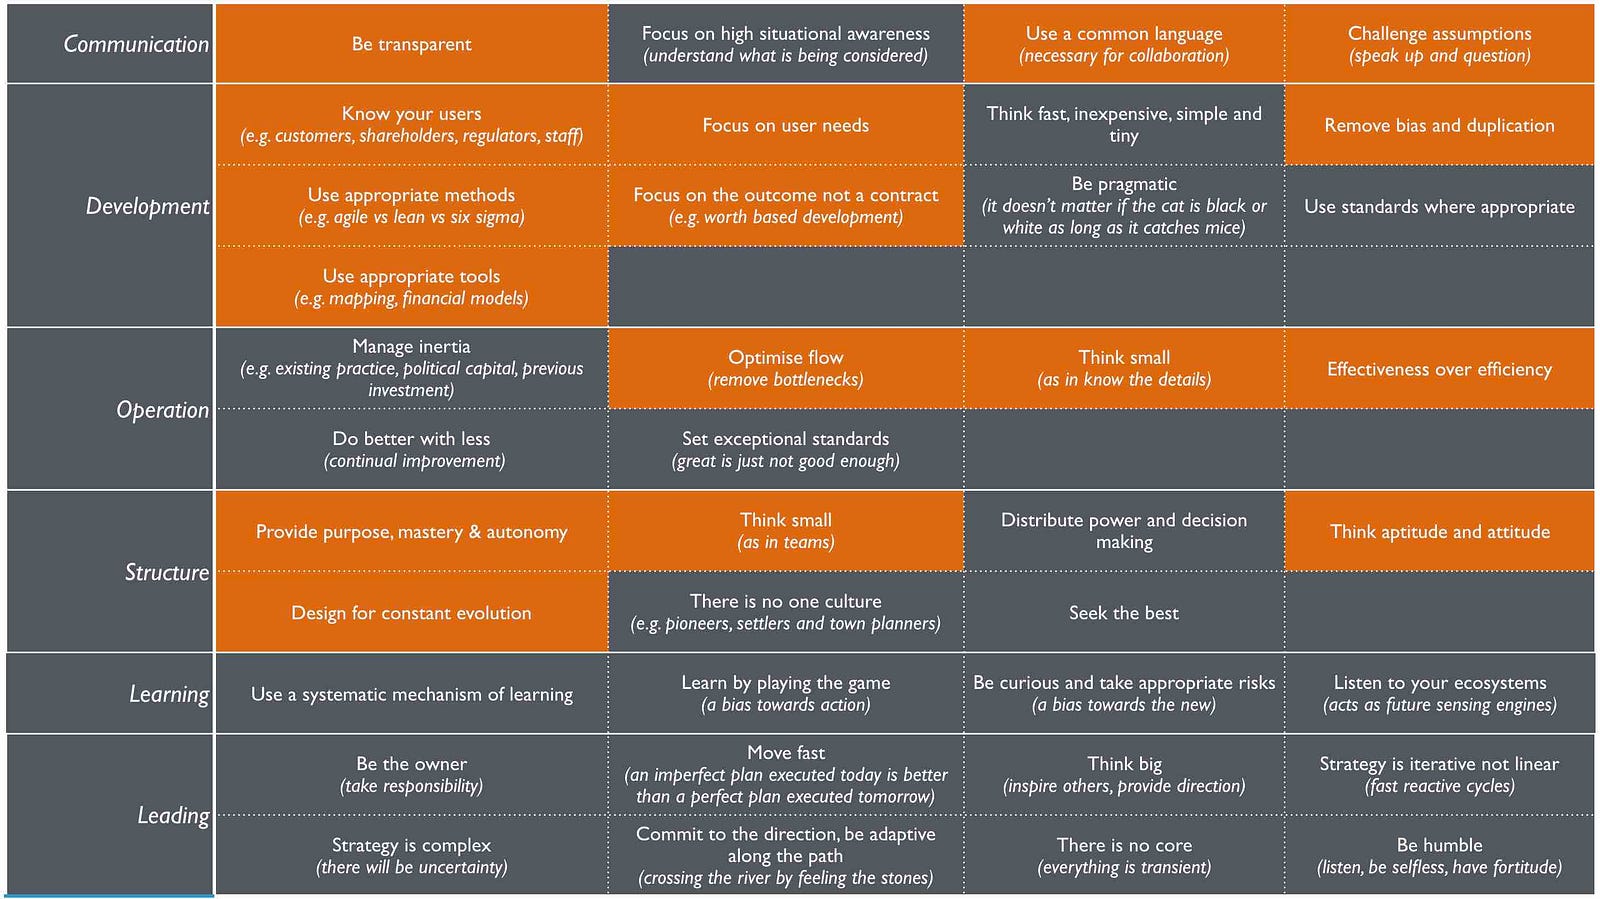
We’ve covered quite a bit of doctrine so far, I’ve highlighted this (in orange) in figure 93. Though we’ve skated over several other areas of doctrine, I do want to come back to them later in the book with a more formal examination.
We’ve also mentioned an aspect of gameplay — Trading. Maps are a form of knowledge capital and they tend to have value. Don’t expect people to just share them with you. You’ll need to trade or create your own.
In the next section we will focus on climate including common economic patterns and anticipation.
I’d like you to take some time and look at figure 93 — doctrine. Go through each of the sections marked in orange, re-read any chapters in this book that you need to and make sure you’re familiar with them. Then ask yourself, does your company have these forms of doctrine? How do you implement them? If not, why not? What is stopping you?