Miscellaneous scripts and notebooks for data scraping, visualisation, statistics, machine learning.
algebra_fitting_polynomials - ordinary and generalised least squares, with a full matrix of covariance, and covariance on the best-fit result
algebra_mean_with_correlations - spelled out math to compute the mean (and associated covariance matrix describe its uncertainty) for data with correlated errors
prior_likelihood_conflict - illustration of the combination of Gaussians and t-distributions (as likelihoods, or prior-likelihood), showing the importance of the behaviour of the tails.
statistical_copulae - intuitive introduction to empirical copulae as joint cumulative distributions, examples of Gaussian, Student-t, and actual APOGEE data.
maximum_likelihood_parallax - brute force illustration of estimating the mean and intrinsic dispersion of a 1D distribution of points with individual measurement errors
gaussian_processes_for_dummies
composite_Gaia_cmd - astroquery for Vizier, twinx and twiny axes, rcParams options

cube_galaxy_sky - maximum likelihood, forward modelling using a selection function
gmm_ngc_2506 - query Gaia data, use sklearn to fit a GMM to the proper motions, pick cluster members

dbscan_ngc_2506 - clustering of NGC 2506 in proper motion space using DBSCAN and HDBSCAN
gaia_archive_queries - examples of simple and advanced ADQL queries and programmatic access to the Gaia archive
Examples using Python libraries for data scraping, cleaning, visualisation, processing.
geotagged_photos_venezia - FlickrAPI, convert date+time strings to datetime objects, get dayofyear, dayofweek etc.

google_trends - use pytrends package to plot search volumes

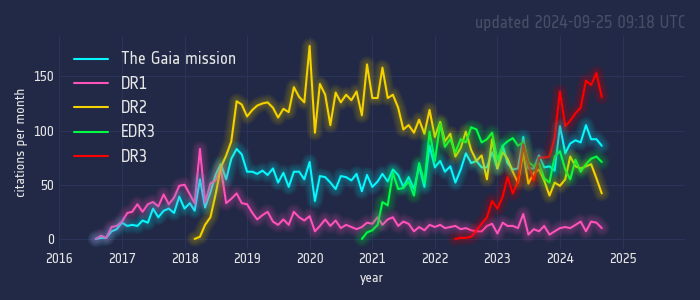
ads_citations_to_gaia_papers - use ADS API and pandas to display monthly citations to Gaia data release papers. Updated daily at this repo including a standalone HTML generated with plotly.
hierarchical_clustering_sp500 - pandas, pct_change, pivot, correlations. scipy, hierarchical clustering, dendrograms.
nba_shot_charts_hexbin - manipulate matplotlib hexbin plots, tweak bin size and color

rookies_bball_ref_2024_race - urllib and BeautifulSoup to get html tags from a table, pandas to read tables from multiple pages
scrape_all_rookie_stats - pandas to read tables, flatten nested columns
google_trends_eclipse_2024 - plotly chloropleth maps, show export to standalone HTML page (interactive version HERE)

max_temp_three_cities - package meteostat for historical weather, cmasher for the cool colour map, colorbar outside the subplots.
bar_chart_color_rain - package meteostat for historical weather, glow, font, legend.
