This project is about programming the robot to make it (understand) what it sees via an RGB-D camera. an RGB-D camera is like a normal camera with a depth sensor. therefore it registers information about the colours (RGB sensors) and depth (distances from the camera to object surfaces).
This report will go through the pipeline of Robot Perception
The three main parts of perception are: filtering the data, clustering relevant objects, and recognizing objects the clustered objects.
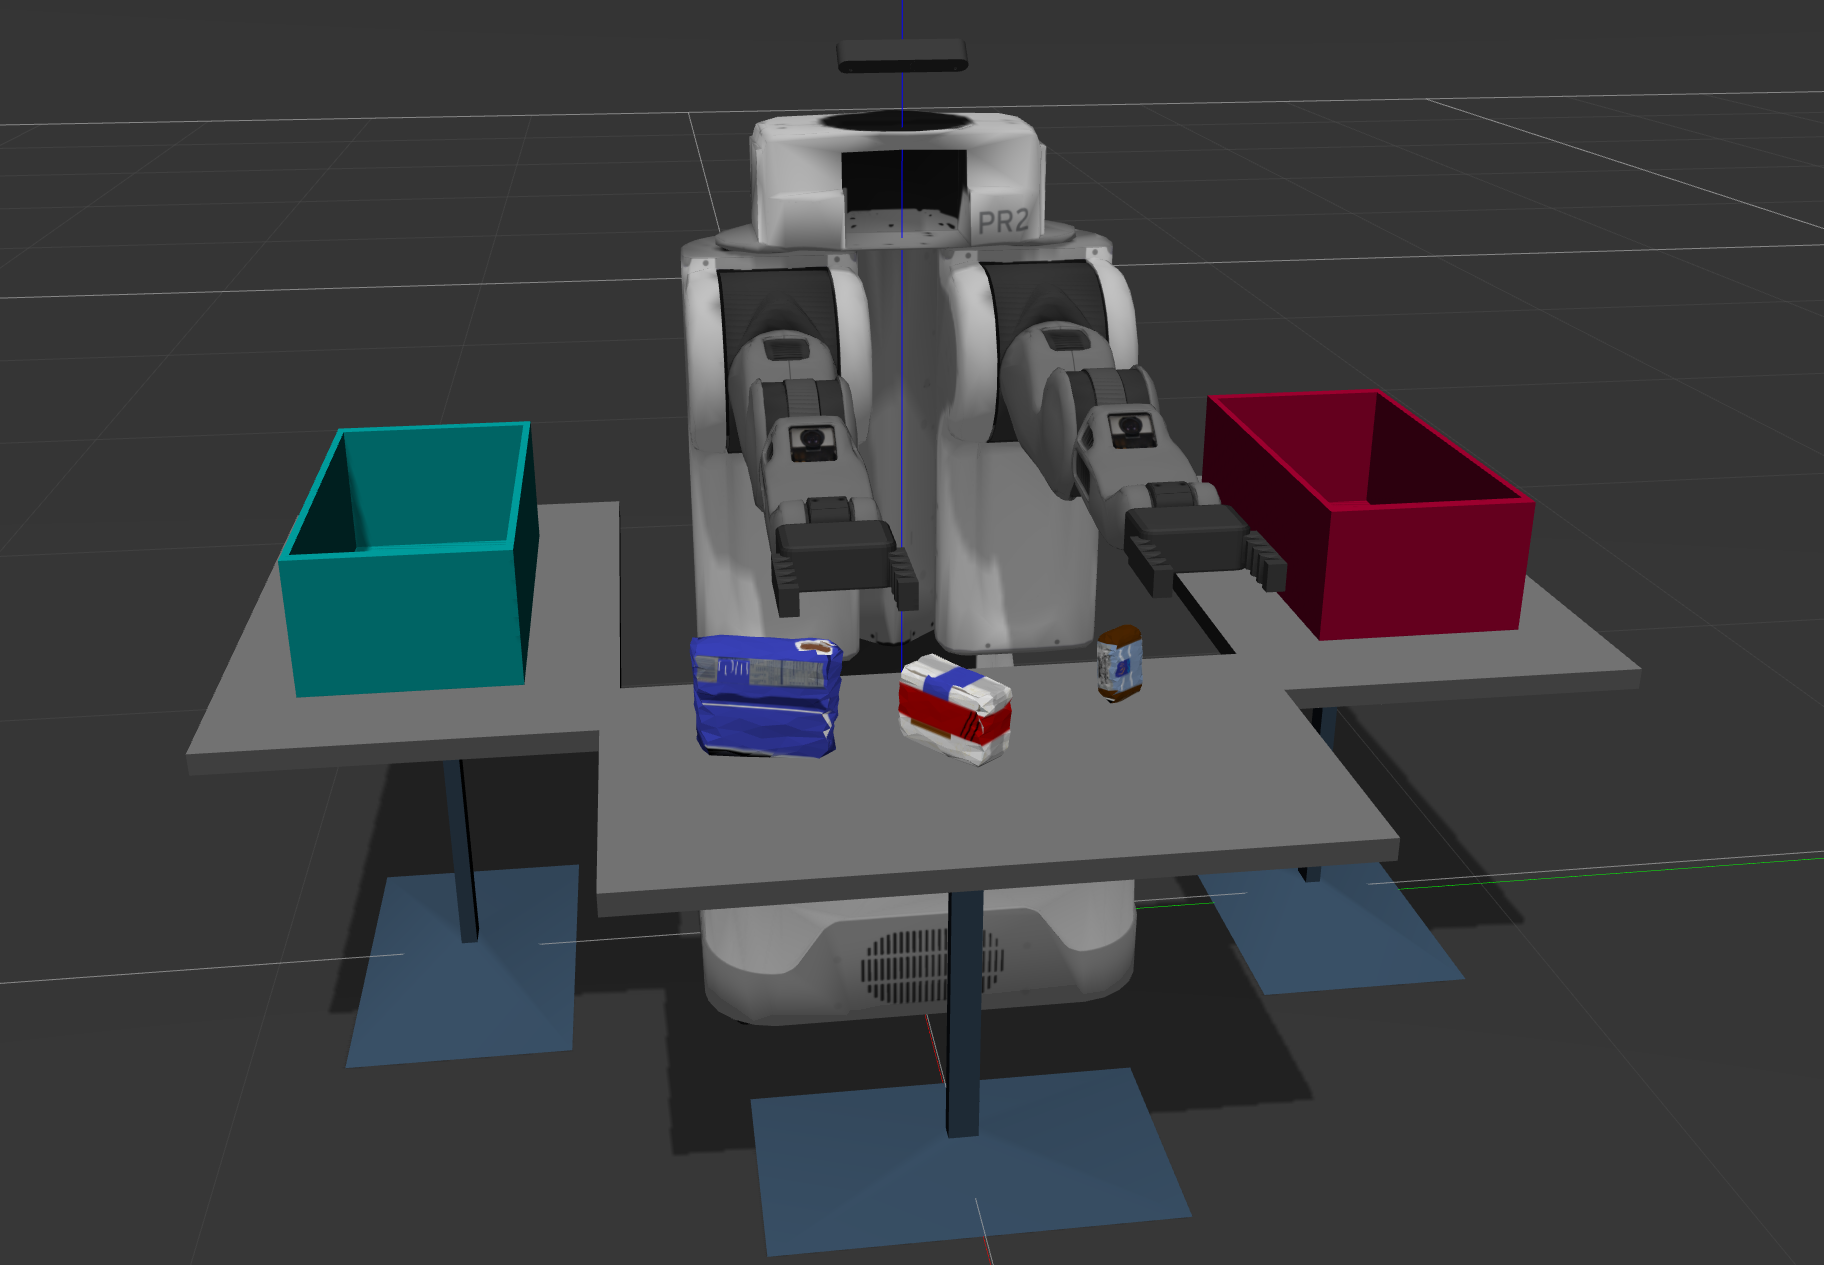
First, the data is stored as a point cloud data The raw point cloud object from the PR2 simulation looks like this:
Sensors come with noise data, in the case of RGB-D cameras, they are manifested as random colour and spacial points over the image. In order to filter the noise, a method as the PCL's StatisticalOutlierRemoval filter computes an average distance to a group of points, if a point is too far whose mean distances are outside a defined interval (determined by a given standard deviation) are removed.
For the PR2 simulation, a mean k value of 20 and a standard deviation of 0.1 provided a cleaner image.
 a voxel to a voxel is the volume equivalent of a pixel to an image,
A voxel downsamples the data by taking the average of the data points inside of it(RGB and Depth). therefore the new set of points are statistically represented by that voxel
a Voxel of 0.01mm was used, small enough to not leave important details out and efficient to compute
Passthrough filter is a 3D-cropping mechanism that works by cropping from two ends along a specified axis.
The PR2 robot simulation needed two passthrough filters for both the Y and Z axis (global). This lets the robot focus only on what it is important. For the Y-axis, whatever was out of -0.4 to 0.4 was cropped, and for the Z axis, it was whatever was outside of 0.6 to 0.9.
Random sample consensus is an iterative model that tests an example of points in a dataset to see if it fits a certain model (here, a group of points are tested if they fit a relationship equation that describes a plane surface in 3D) after certain iterations, a model can be confirmed existent (a plane is found at certain points), the dataset is then divided into groups, inliers are the points that fit the model, outliers are the ones that do not fit --this method could be also used as outlier removal method--.
A max distance value of 0.01 was used as the same voxel size
The extracted inliers included the table.

The extracted outliers was everything else( the objects on the table):
With a filtered point cloud, we can perform segmentation.
The two main clustering algorithms here are:
-
K-means is used for (pre-defined) number of clusters
-
DBSCAN
The density-based spatial cluster of applications with noise (also called Euclidean clustering) is a clustering algorithm that creates clusters by grouping data points. DBscan starts with one point, then hops to other points within predefined distance till it reaches edge points that cannot hop further through. these points now form a cluster.
DBscan finds other clusters the same way, nevertheless, if there's a certain cluster that has less than a minimum defined number of points, it is considered an outlier cluster or noise
DBSCAN receive a K-d tree data type, look at this quick lesson here
DBSCAN has an advantage over k-means because you need to know about the density of the data not the number of clusters, which you may not have
because KDtree is a spacial data type (based on spatial info) the data was converted to only x,y,z point cloud. DBSCAN is performed then indices of clusters are returned, we extracted
the clusters from the cloud and randomly coloured each cluster as shown:
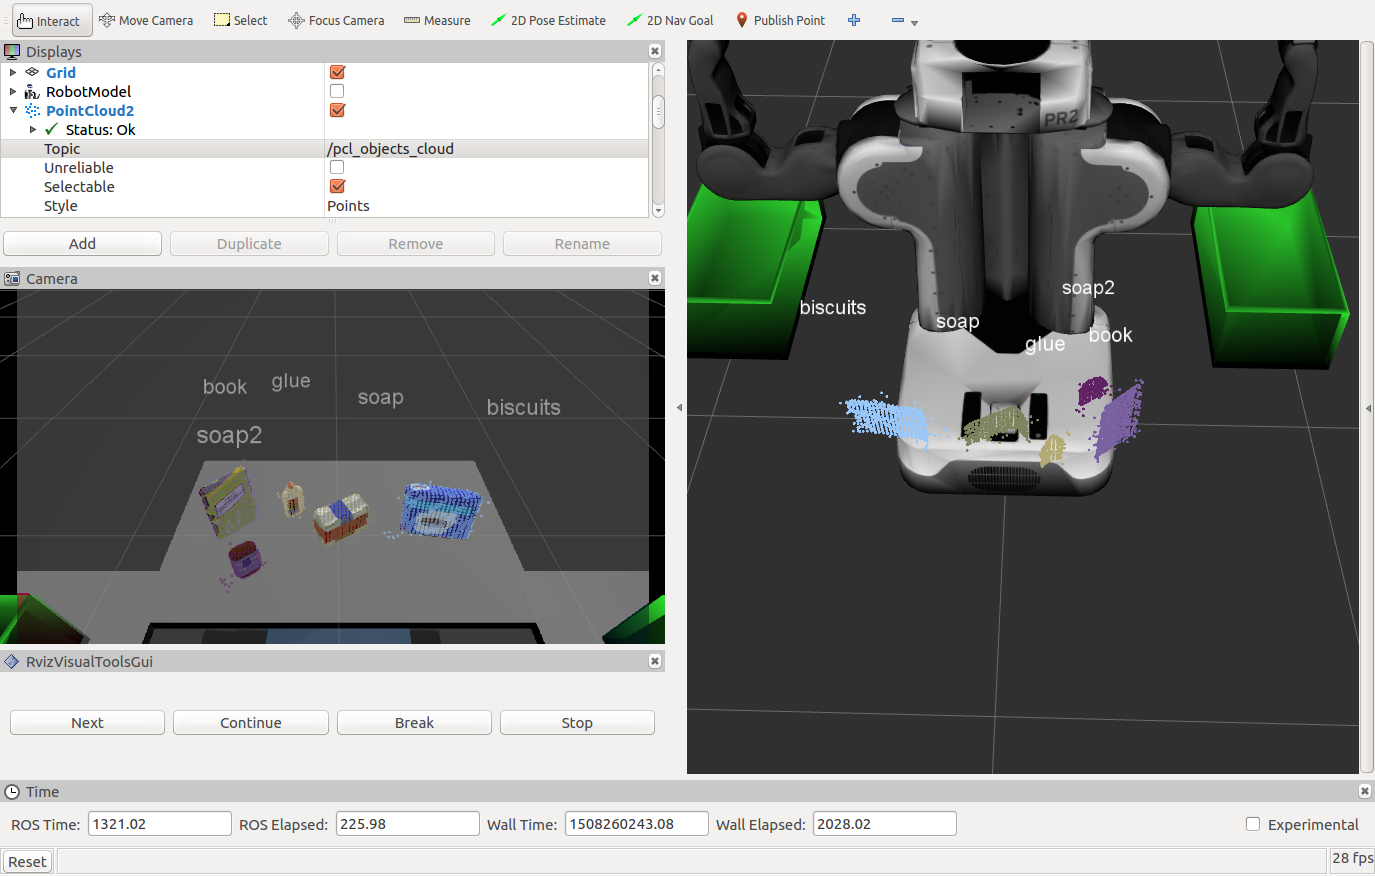
 The object recognition code allows each cluster to be examined and identified. In order to do this, the system first needs to get trained to make a model to learn what each object looks like. Once it makes the model, the system can then predict which object it sees.
The Robot can extract color and normal histograms of objects
A support vector machine (SVM) is used to train the model. The SVM creates a model from a predefined histogram data from a training set. the training set file is generated from capture_features_pr2.py script, then the robot classifies to best what it see to the model it made of what it already learned (cool huh?). a linear kernel using a C value of 0.1 is found accurate.
For corss validation, a repetition of 20 was enough for the first scene, however, 40 repetitions were enough for the other two worlds.
For the project, the object identification general accuracy was of 97%
The confusion matrices below shows the normalized results for a test case using the trained model generated above.
The training for the third test scene normalized result:

The PR2 robot simulation has three test scenes to evaluate the object recognition pipeline. The following sections demonstrate each one:
Please Do find the Training Set, model and out Yaml files in the output folder


